When it comes to evaluating investment performance, the Sharpe Ratio has become one of the most respected tools. Named after Nobel laureate William F. Sharpe, the Sharpe Ratio is more than just a statistical measure; it’s a powerful tool that helps investors understand the risk-adjusted return of an investment strategy.
In this article, we’ll explore what the Sharpe Ratio is, why it’s such a critical measure of investment performance, and how the investment models at Model Investing outperform their benchmarks with impressive Sharpe Ratios.
What is the Sharpe Ratio?
The Sharpe Ratio is a metric used to evaluate the risk-adjusted return of an investment portfolio. In simpler terms, it measures how much return an investment generates per unit of risk taken. The formula is straightforward:

The Sharpe Ratio provides a clear view of whether an investment’s returns are due to smart investing or excessive risk-taking. Generally, a higher Sharpe Ratio indicates a better risk-adjusted return, while a lower ratio may suggest the returns are not worth the level of risk assumed.
Why Sharpe Ratios are Crucial in Evaluating Investments
The investment world offers numerous performance measures, but the Sharpe Ratio is particularly useful for several reasons:
Risk-Adjusted Return:
Unlike absolute return measures, the Sharpe Ratio incorporates risk. This is essential because, without risk-adjusted performance, investors could end up comparing investments that are not comparable due to their differing levels of volatility. The Sharpe Ratio normalizes this, allowing for a fair comparison.
Consistent Decision-Making:
By focusing on risk-adjusted returns, the Sharpe Ratio helps investors avoid the trap of “chasing returns.” In periods of market exuberance, high returns are often accompanied by high risks. The Sharpe Ratio brings clarity, enabling investors to seek high returns with acceptable levels of risk.
Better Benchmarking:
Comparing an investment’s Sharpe Ratio with that of a benchmark provides a clearer picture of performance. An investment may outperform in raw returns, but if it carries more risk, the Sharpe Ratio may reveal it to be less desirable on a risk-adjusted basis.
Holistic Portfolio Evaluation:
For portfolios composed of multiple assets, the Sharpe Ratio offers insight into the overall efficiency of the portfolio’s diversification. If the portfolio has a high Sharpe Ratio, it’s generally an indication that it effectively balances risk and return.
While there are other risk-adjusted return metrics, the Sharpe Ratio remains one of the most comprehensive, simple, and actionable. It’s particularly powerful because it translates complex risk and return data into an easy-to-understand number, making it accessible for investors of all experience levels.
Model Investing’s Sharpe Ratios: A Benchmark-Beating Performance
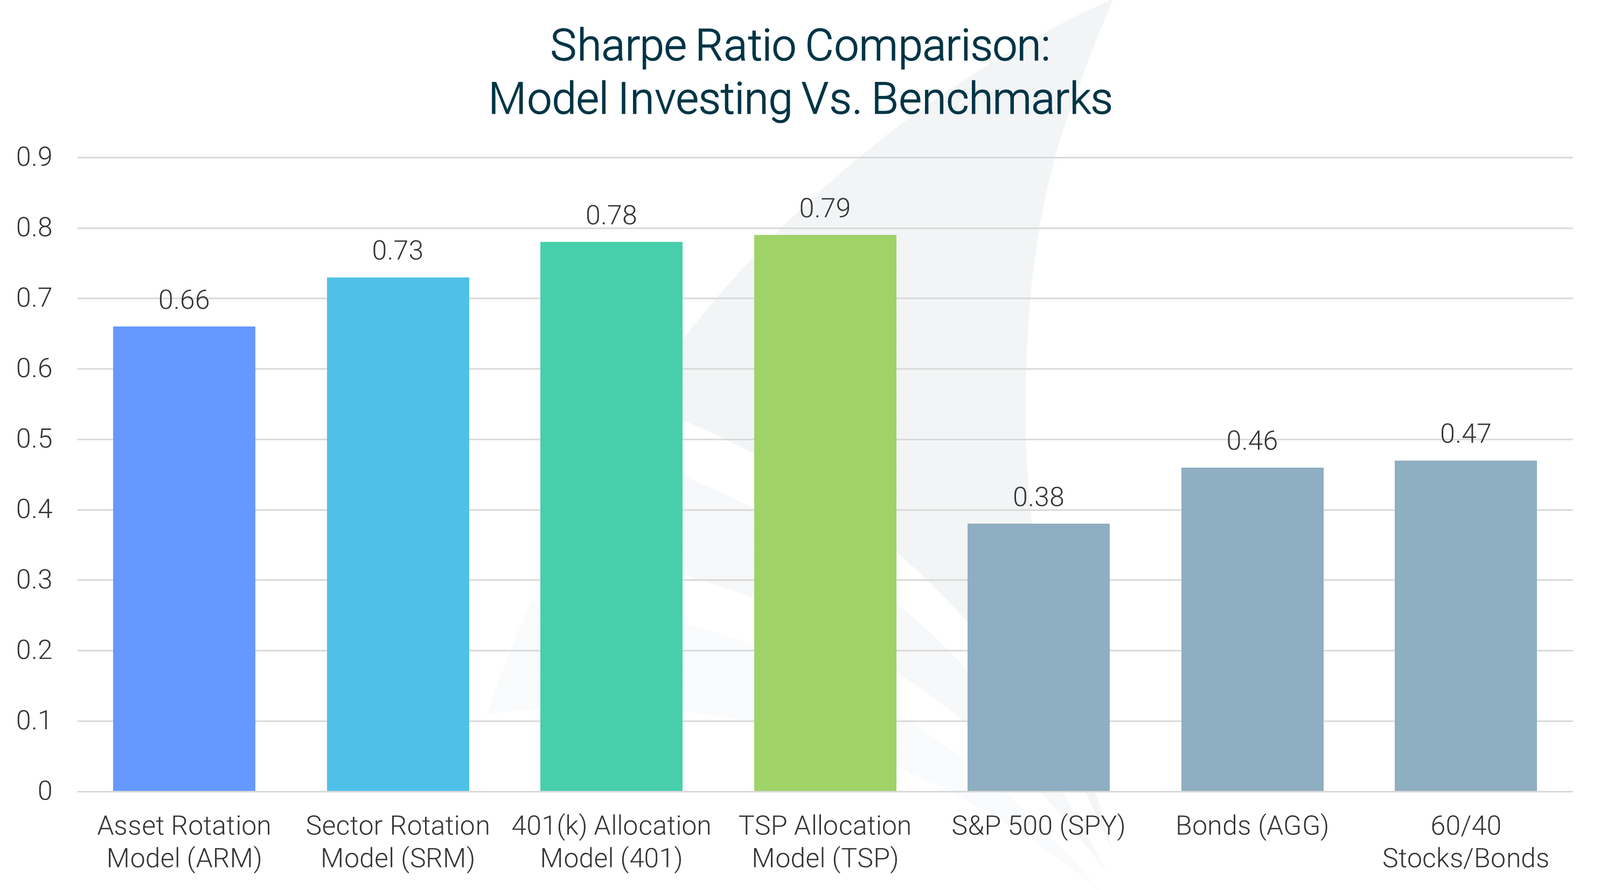
At Model Investing, the Sharpe Ratios of the four investment models stand out because they not only provide strong returns, but also do so with relatively lower volatility compared to their benchmarks. Each model’s Sharpe Ratio surpasses that of similar investment products, making them compelling choices for investors who prioritize risk-adjusted returns.
Asset Rotation Model:
The Asset Rotation Model is designed to manage risk while generating consistent returns. By balancing stocks, bonds, and other asset classes based on market conditions, the model achieves a high Sharpe Ratio. Its Sharpe Ratio consistently outperforms typical balanced funds, which means it offers stronger returns without taking on excessive risk.
Sector Rotation Model:
Focused on sector rotation, the Sector Rotation Model seeks out the highest-performing sectors at any given time. Sector-based investing can be volatile, but by using data-driven insights, this model maximizes returns while keeping volatility in check. As a result, its Sharpe Ratio beats the benchmarks for sector funds, proving that well-timed sector investments can provide superior risk-adjusted returns.
401(k) Allocation Model:
For investors looking to maximize retirement savings, the 401(k) Allocation Model is designed to balance growth with preservation of capital. By adjusting allocations according to market conditions, it maintains a high Sharpe Ratio, which is particularly valuable for retirement-focused investors. Compared to typical 401(k) target-date funds, this model’s Sharpe Ratio shines, showing that it is possible to achieve better risk-adjusted returns in retirement accounts.
TSP Allocation Model:
Designed for federal employees and military members, the TSP Allocation Model optimizes the Thrift Savings Plan by adjusting exposure to various TSP funds. This model’s Sharpe Ratio far exceeds that of the traditional TSP fund offerings, giving TSP participants a powerful tool to grow their retirement funds with managed risk.
Why Outperforming with Sharpe Ratios Matters
The fact that Model Investing’s Sharpe Ratios outperform those of traditional benchmarks is significant for several reasons:
Enhanced Return for Every Unit of Risk: A higher Sharpe Ratio means that Model Investing’s models are not just providing raw returns but are achieving them with a superior level of risk management. Investors gain more peace of mind knowing that these models are designed to weather market ups and downs efficiently.
More Resilience in Down Markets: High Sharpe Ratios suggest that these models are better equipped to handle market declines. When the markets are turbulent, having a higher Sharpe Ratio can mean that the portfolio is less volatile and thus less likely to suffer severe losses. This resilience is a major advantage for those focused on long-term growth.
Competitive Edge: By consistently exceeding the Sharpe Ratios of benchmarks, Model Investing’s models demonstrate a competitive advantage in the investment world. Investors looking for reliable performance and controlled risk have compelling evidence that these models will outperform traditional, unmanaged alternatives.
Using the Sharpe Ratio to Guide Investment Decisions
For investors, the Sharpe Ratio is a critical tool when evaluating any portfolio or fund. However, not all high Sharpe Ratios are created equal. Some funds achieve high Sharpe Ratios by investing in low-volatility assets, which can limit growth potential. At Model Investing, the four models strive to achieve high Sharpe Ratios without sacrificing growth – providing the best of both worlds.
To illustrate, imagine two portfolios with similar returns. If one has a higher Sharpe Ratio, it means it has generated those returns with less risk. This is precisely what Model Investing’s models achieve, allowing investors to maximize returns while keeping their exposure to market risk as low as possible.
Final Thoughts
Sharpe Ratios are more than just a metric; they are a window into the efficiency of an investment. Model Investing’s high Sharpe Ratios across all four models prove that achieving exceptional returns does not require taking on excessive risk. By consistently surpassing benchmarks, these models stand out as excellent tools for investors who want strong, risk-adjusted returns.
When evaluating an investment opportunity, always look beyond the raw return and consider how much risk is involved. With high Sharpe Ratios, Model Investing’s selection of Investment Models deliver performance with confidence. It’s a unique offering in the investment landscape – one that promises growth with a clear eye on risk.
Investors who prioritize stability and long-term growth would do well to consider the Sharpe Ratios of Model Investing’s offerings. After all, when it comes to building wealth, balancing return with risk is one of the most crucial aspects of a successful investment journey.

An innovative approach for eaming higher returns with less risk
Download Report (1.2M PDF)You don’t want to look back and know you could’ve done better.
See Pricing
