A rules-based sector rotation strategy that targets the strongest-performing sectors of the S&P 500 to pursue higher growth while managing downside risk.
Over the past 26 years, it has outperformed the S&P 500 with significantly
less downside exposure.
The best-performing strategy in my portfolio, hands down.
— Dan Bennett, Tax Consultant
SRM Quick links
Investors looking to outperform the S&P 500 by targeting the strongest sectors each month.
The Sector Rotation Model (SRM) helps investors pursue higher returns by providing monthly recommendations that target the strongest-performing sectors of the S&P 500. Rather than holding the entire market, the SRM focuses your portfolio on the areas with the most growth potential.
The SRM is designed for use in tax-advantaged accounts like IRAs and Roth IRAs, where more frequent adjustments won’t trigger short-term capital gains taxes.
Typical time to implement: 5-10 minutes
Recommendation frequency: Monthly
The Sector Rotation Model has consistently outperformed the S&P 500 over the past 26 years, delivering higher compound returns while cutting losses significantly during major market downturns. This performance is driven by the model’s rules-based approach to identifying and allocating to the strongest-performing sectors each month.
Backtested Performance (2000 - Present)
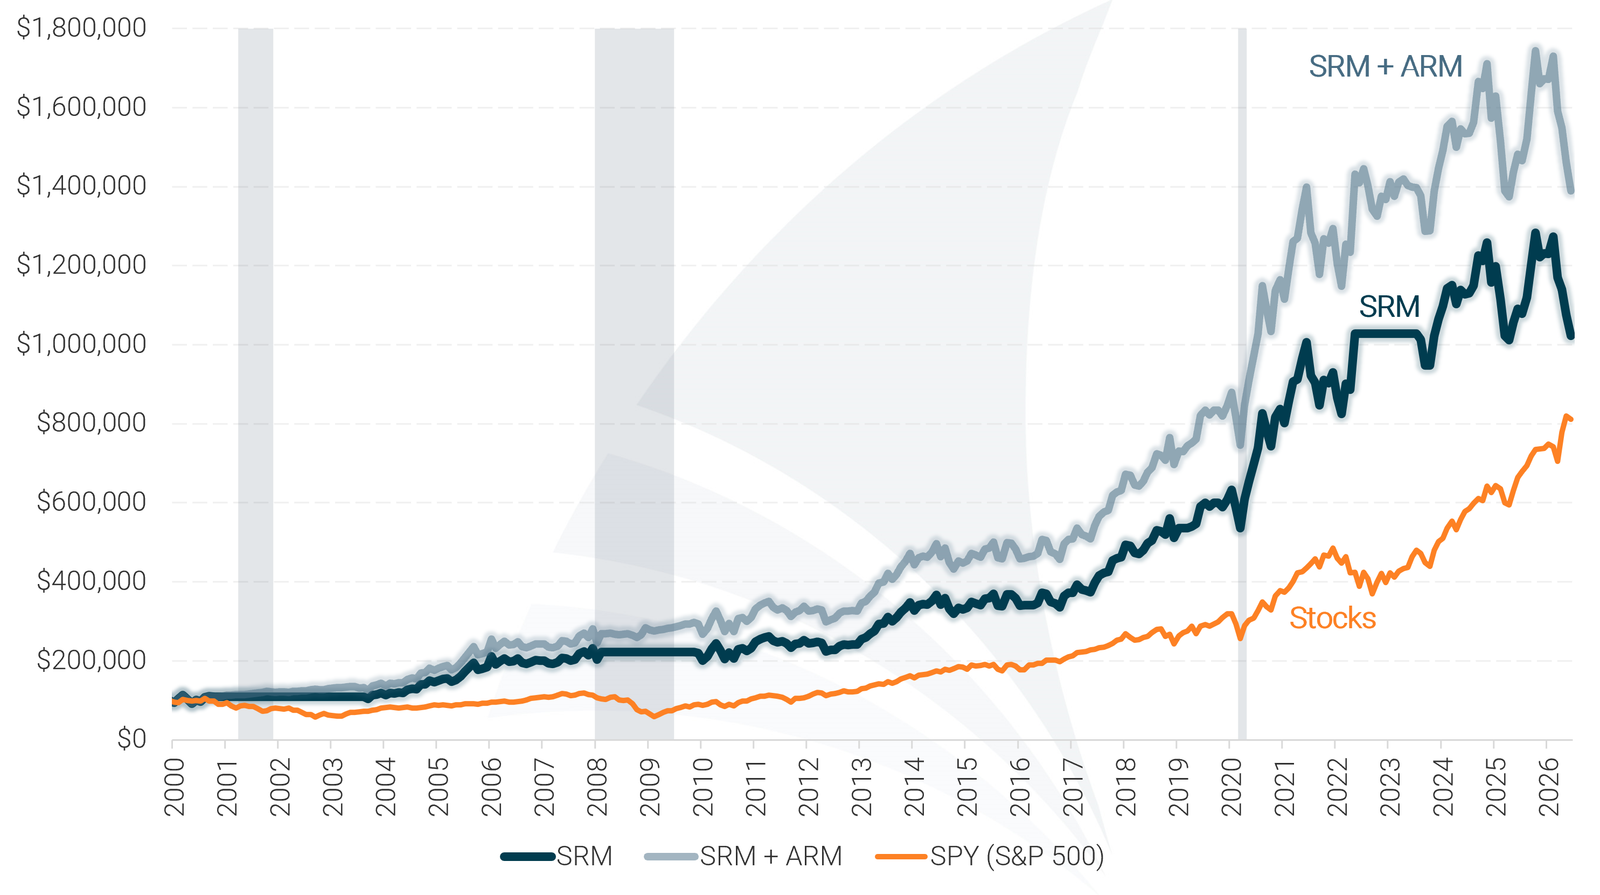
Model performance represents total returns and includes reinvestment of dividends and interest. No management fees or transaction costs are included. Historical performance is not an indication or guarantee of future performance.
Many investors hold broad-market index funds regardless of what’s happening across individual sectors. While simple, this approach means your portfolio is always exposed to underperforming areas of the market — even when stronger opportunities exist elsewhere.
The Sector Rotation Model takes a different path, using a disciplined, rules-based process to identify and allocate to the strongest sectors of the S&P 500 based on current market conditions. When no sectors show strength, the model can move to cash for protection.
Rather than remaining locked into a broad-market position, the SRM focuses your portfolio on the areas with the most momentum. This helps capture sector-level growth while avoiding the drag of weaker areas.
Markets don’t move uniformly. At any given time, some sectors are leading while others are lagging. Portfolios that hold the entire market equally miss the opportunity to concentrate on strength.
The SRM helps you:
It’s proactive, easy to follow, and designed to deliver stronger results than broad-market strategies — while keeping you in control of your portfolio.

Stronger growth by focusing on leading sectors
The SRM has historically delivered stronger long-term returns by concentrating on top-performing sectors rather than holding the entire market.

Smaller losses during major market downturns
By shifting to cash when broad market conditions deteriorate, the SRM has consistently experienced smaller declines during severe market downturns

Faster recovery as markets improve
By reallocating to leading sectors as conditions strengthen, the SRM has historically recovered faster following periods of market weakness.
The table below provides additional detail for those who want a deeper look at the SRM’s historical performance. A plain-English explanation of these metrics is available, but it’s not required to follow and use the model.
| Sector Rotation Model (SRM) Performance Metrics | ||||||||
|---|---|---|---|---|---|---|---|---|
| Strategy | Compound Annual Return | Alpha1 | Beta1 | Standard Deviation | Maximum Drawdown | Sharpe Ratio | Sortino Ratio | Treynor Ratio |
| SRM | 10.14% | 6.71% | 0.27 | 12.3% | -19.6% | 0.71 | 2.51 | 0.32 |
| SRM + ARM | 11.44% | 8.32% | 0.22 | 11.5% | -19.6% | 0.87 | 5.25 | 0.45 |
| SPY (S&P 500) | 7.99% | 0.00% | 1.00 | 17.9% | -50.8% | 0.43 | 0.48 | 0.08 |
| Data for 26-Year Period (2000 – 2025) 1 Benchmarked against the S&P 500 |
||||||||
VIEW THE PLAIN-ENGLISH EXPLANATION OF THESE METRICS
The Sector Rotation Model follows a structured, rules-based process designed to keep your portfolio focused on the strongest sectors of the market without constant monitoring.
You don’t need to monitor markets, follow financial news, or make judgment calls.
Each month, the model evaluates all 11 sectors of the S&P 500 to identify which sectors are showing the most strength.
Based on that analysis, the model determines the recommended sector allocation — concentrating on the strongest-performing areas of the market.
When broad market conditions weaken and no sectors show strength, the model can move to cash for protection. Investors can also follow the ARM to allocate into bonds during these periods.
You review the recommendation and make the changes directly in your investment account. A step-by-step tutorial walks you through the process.
The SRM is designed to be practical, repeatable, and easy to follow. These features are built in — you just follow the monthly recommendation.
Rather than holding the entire market, the SRM targets the sectors with the most momentum concentrating your portfolio where growth potential is highest.
All allocation decisions follow predefined rules, removing emotion and guesswork from the investment process.
When market conditions deteriorate, the model can shift to cash, helping protect your portfolio from major losses.
You stay in control of your account. The model provides the guidance — you implement the changes directly in your own account.
See how investors are using the Sector Rotation Model to pursue higher growth in their portfolios.
“The SRM has completely changed how I invest. Instead of passively holding broad-market funds, I now target the best-performing sectors each month. It’s made a world of difference!”

Dan Bennett
Tax Consultant
“I was struggling to outperform the market until I started using the SRM. Its sector-based approach has delivered results far beyond my expectations, and it’s been surprisingly simple to follow.”

Jenna Solia
Supply Chain Sr. Analyst
“I’ve combined the SRM with the ARM to take full advantage of both strategies. During volatile markets, the ARM provides a safety net, while the SRM helps me capture strong sector performance when markets are bullish.”

Emma Rodriguez
Event Planner
“I always heard that sector investing was a great strategy, but I never knew how to do it properly. The SRM changed that. It takes the guesswork out of investing and makes sure I stay away from dangerous pockets of the market.”

Robert Mitchell
Senior Accountant
“I used to waste hours reading financial news and still felt lost. The SRM does the hard work for me, and now my portfolio is thriving with minimal effort. I’ve been using it with the ARM.”

Kim Young
PR Specialist
“I used to chase trends without success. The SRM’s data-driven approach has aligned my investments with top-performing sectors consistently. I find this much more manageable than constantly picking stocks.”

Ben Clark
Graphic Designer
“Before the SRM, I was stuck in a buy-and-hold mentality, missing out on big opportunities. This model showed me how to be proactive without constantly trading.”

Arjun Patel
IT Consultant
Designed for investors who want to go beyond broad-market returns by targeting the strongest sectors of the S&P 500.

The SRM targets leading sectors rather than holding the entire market, focusing your portfolio where momentum is strongest

The SRM’s higher turnover is best suited for tax-advantaged accounts where frequent changes won’t trigger capital gains taxes.

Pair the SRM with the Asset Rotation Model for a strategy that captures sector-level growth while maintaining a defensive bond position when stocks weaken.

The SRM carries more volatility than the ARM, but it’s designed for investors comfortable with tactical adjustments in pursuit of higher long-term growth.
01
Visit our pricing page to choose the membership option that fits you best and begin your free month. Get instant access to the Sector Rotation Model and our other investment models.
02
Each month, you’ll receive the latest SRM sector recommendations. Follow the step-by-step SRM Tutorial to implement the update correctly.
03
Monitor your portfolio using your investment account’s online portal and compare results to benchmarks over time.
The Sector Rotation Model (SRM) is a high-performing ETF Sector Rotation Model designed to identify and invest in the strongest-performing sectors of the stock market. By dynamically reallocating investments each month, the SRM ensures your portfolio remains focused on sectors with the highest growth potential.
During periods when stocks are rising, different sectors of the market take turns leading the way higher. The Sector Rotation Model (SRM) analyzes each sector independently to identify and invest in the strongest performing sectors of the market. Learn More
The Sector Rotation Model (SRM) is ideal for investors seeking higher returns by actively allocating to the strongest market sectors. Suitable for all investors, it can be a valuable addition to any portfolio. The SRM is designed for those willing to take on slightly more risk in exchange for the potential for greater long-term growth.
When compared to the Asset Rotation Model, the SRM achieves higher returns at the expense of additional volatility. As a result, we recommend using the ARM (or our 401 Model or TSP Model) for the majority your portfolio, and using the SRM for the balance. This ensures adequate diversification while still enhancing your portfolio’s growth potential.
You can view the SRM’s historical backtested performance on the SRM Overview page. Be sure to review the risk metrics table, where you’ll see that the SRM’s sector investing strategy has consistently outperformed the S&P 500 while exposing the portfolio to significantly less risk. This highlights the model’s ability to deliver superior returns without unnecessary volatility.
The SRM’s sector allocation strategy leverages proprietary technology to continuously identify and invest in the top-performing sectors as they cycle through periods of strength. By dynamically reallocating capital to the strongest sectors, the SRM captures market upside more effectively than traditional strategies. When broader market conditions deteriorate, the SRM can shift to cash, helping to protect your portfolio from major downturns.
You can view the latest SRM recommendations on the current recommendations page. A premium subscription is required for access.
Using the SRM is simple. Each month, you’ll receive an alert when the latest SRM recommendations are posted. Just log in to your brokerage account and update your investments accordingly. For a step-by-step guide on implementing the model, visit the SRM Tutorial.
Absolutely. With longer life expectancies, it’s essential that your investments continue to grow throughout retirement. The Sector Rotation Model (SRM) has historically outperformed both stocks and bonds while also avoiding major losses during market downturns. This makes it a strong option for retirees looking to preserve and grow their wealth. For more information on how to de-risk your portfolio during retirement, please see this article.
In most cases, no. The Sector Rotation Model (SRM) is designed to use low-cost ETFs with minimal trading, and most brokerage firms no longer charge commissions on ETF trades. This means you can follow the SRM’s recommendations without worrying about extra costs, allowing you to keep more of your returns and maximize long-term growth.
The Sector Rotation Model (SRM) is designed to detect early signs of market weakness and typically moves to cash before major downturns unfold. This proactive approach helps protect your portfolio from significant losses. When the SRM shifts to cash, we recommend following the Asset Rotation Model (ARM) with those funds until the SRM signals a reentry into the stock market.
Yes, to a degree. The Asset Rotation Model (ARM) and Sector Rotation Model (SRM) complement each other by aligning their stock market exposure. When the ARM signals an investment in stocks, you can use the SRM to identify and allocate to the top-performing sectors for maximum growth. Conversely, when the SRM moves to cash, the ARM can help determine whether bonds provide a more stable alternative for that capital, ensuring your portfolio remains optimized in any market environment.
This refers to a combined strategy that leverages both the Sector Rotation Model (SRM) and the Asset Rotation Model (ARM) to optimize returns while managing risk. Specifically, it means following the SRM when it is invested in the stock market to capture sector-based growth and switching to the ARM when the SRM moves to cash.
Many factors can influence this, but in bull markets, sectors like Technology, Consumer Discretionary, and Financials often lead as economic growth boosts spending and corporate profits. In bear markets, defensive sectors such as Utilities, Consumer Staples, and Health Care tend to be more resilient due to steady demand. Since no sector consistently outperforms, the SRM continuously analyzes market trends and reallocates to the strongest-performing sectors each month.