A rules-based strategy that shifts between G, F, C, S, and I funds to boost long-term returns, manage volatility, and stay aligned with market conditions.
Over the past 26 years, it has outperformed the C Fund (S&P 500),
F Fund (Bonds), and a 60/40 mix.
One of the best decisions I've made for my TSP
— Michael Cartier, Signals Intelligence Analyst, USMC
TSP Quick links
Federal employees and military members who want to know exactly which TSP funds to be in each month.
The TSP Allocation Model helps federal employees and military personnel optimize their Thrift Savings Plan (TSP) by providing monthly allocation recommendations across the G, F, C, S, and I funds. It’s designed to pursue growth in stronger markets while shifting to safer funds during volatility.
Typical time to implement: 5–10 minutes
Recommendation frequency: Monthly
The TSP Allocation Model has consistently outperformed stock and bond benchmarks over the past 26 years, delivering higher compound returns than the C Fund (S&P 500), the F Fund (Bonds), and a standard 60/40 mix, while cutting losses nearly in half during major market downturns. This performance is driven by the model’s rules-based approach to shifting allocations as market conditions change.
Backtested Performance (2000 - Present)
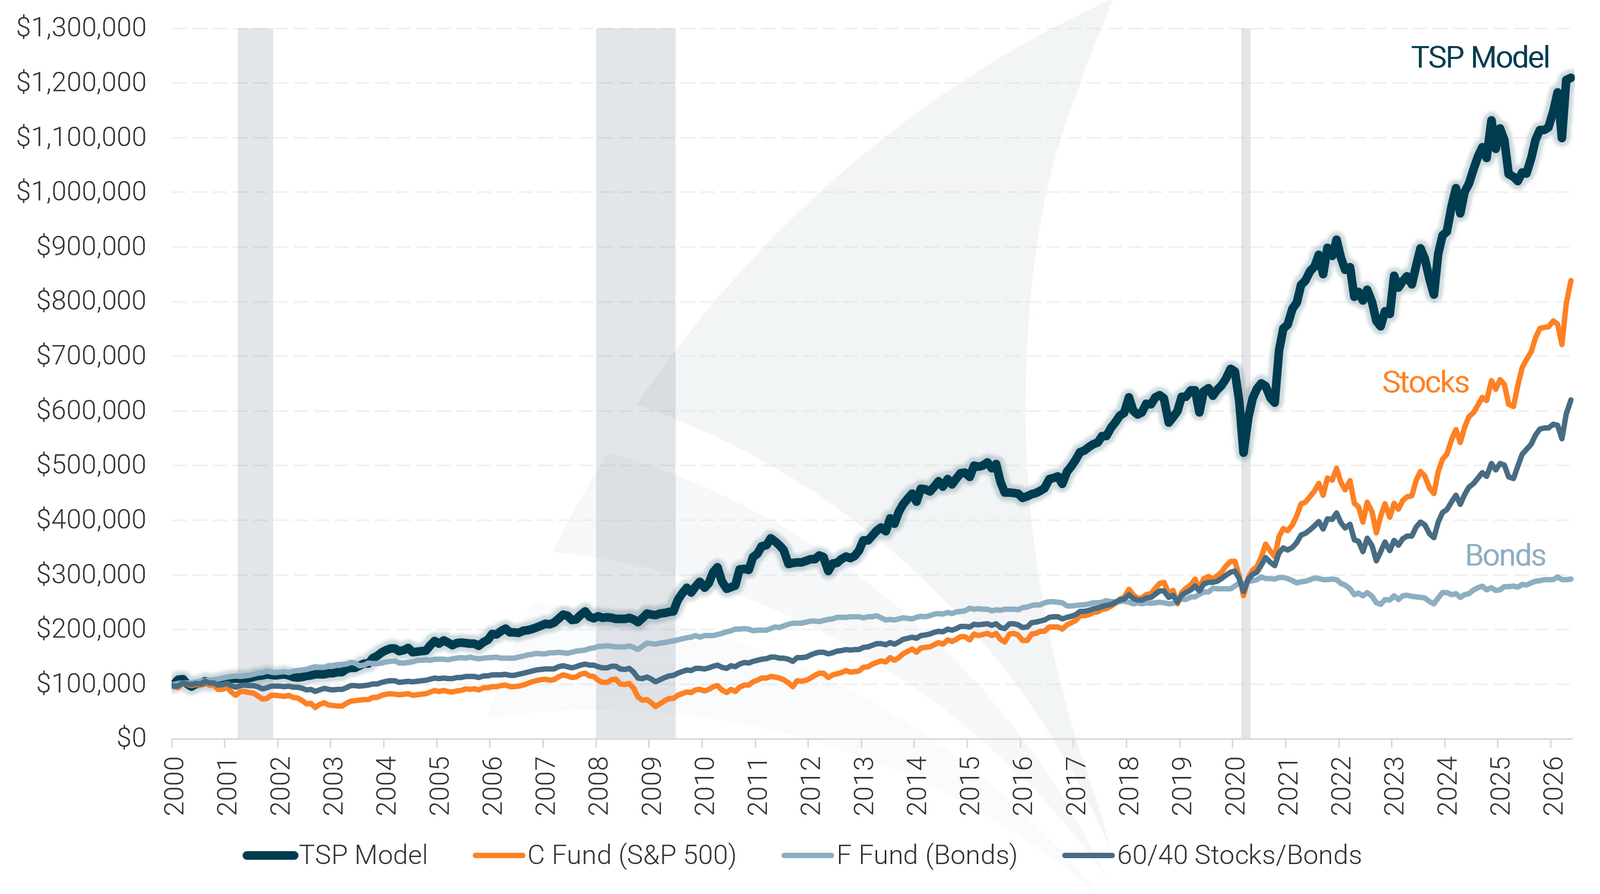
Model performance represents total returns and includes reinvestment of dividends and interest. No management fees or transaction costs are included. Historical performance is not an indication or guarantee of future performance.
Many TSP investors rely on static, age-based allocation rules — like the Lifecycle (L) funds — that remain fixed regardless of what’s happening in the market. While simple, those approaches can drift out of alignment as conditions change. The TSP Allocation Model takes a different path, using a disciplined, rules-based process to shift between the G, F, C, S, and I funds based on current market conditions.
Rather than remaining locked into a preset allocation, the TSP Model adjusts positioning as market environments evolve. This helps keep your TSP aligned with prevailing trends while avoiding unnecessary risk or complexity.
Markets move through cycles. When conditions change, TSP allocations that remain static can become misaligned, either taking on more risk than intended or staying invested in weaker areas for too long.
The TSP Model helps you:
It’s proactive, easy to follow, and designed to deliver stronger results than static strategies while keeping you in control of your retirement plan.
Stronger long-term growth without unnecessary swings
The TSP Model has historically delivered stronger long-term returns while experiencing less extreme ups and downs than individual TSP funds or static allocations.
Smaller losses during major market downturns
Compared to staying fully invested in the C Fund or a 60/40 mix, the TSP Model has consistently experienced smaller declines during severe market downturns.
Faster recovery as markets improve
By shifting back toward growth oriented funds as conditions strengthen, the TSP Model
has historically recovered faster following periods of market weakness.
The table below provides additional detail for those who want a deeper look at the TSP Model’s historical performance. A plain-English explanation of these metrics is available, but it’s not required to follow and use the model effectively.
| TSP Model Performance Metrics | ||||||||
|---|---|---|---|---|---|---|---|---|
| Strategy | Compound Annual Return | Alpha1 | Beta1 | Standard Deviation | Maximum Drawdown | Sharpe Ratio | Sortino Ratio | Treynor Ratio |
| TSP Model | 9.73% | 4.90% | 0.44 | 10.8% | -22.8% | 0.77 | 1.68 | 0.19 |
| C Fund (S&P 500) | 8.08% | 0.00% | 1.00 | 18.0% | -50.9% | 0.43 | 0.48 | 0.08 |
| F Fund (Bonds) | 4.19% | N/A | 0.02 | 4.9% | -16.7% | 0.49 | 0.59 | N/A |
| 60/40 Stocks/Bonds | 6.91% | 1.24% | 0.54 | 10.2% | -23.7% | 0.54 | 0.65 | 0.10 |
| Data for 26-Year Period (2000 – 2025) 1 Benchmarked against the C Fund |
||||||||
View the plain-English explanation of these metrics
The TSP Allocation Model follows a structured, rules-based process designed to keep your TSP aligned with changing market conditions without constant monitoring.
You don’t need to monitor markets, follow financial news, or make judgment calls.
Each month, the model evaluates the performance of the G, F, C, S, and I funds alongside current market conditions.
Based on that analysis, the model determines the recommended allocation across TSP funds — shifting toward growth when conditions are favorable and toward safer funds when they’re not.
The model updates on a monthly schedule, keeping the process simple and avoiding unnecessary short-term changes.
You review the recommendation and make the changes directly in your TSP account. A step-by-step tutorial walks you through the process.
The TSP Model is designed to be practical, repeatable, and easy to follow. These features are built in — you just follow the monthly recommendation.
Clear monthly recommendations across the G, F, C, S, and I funds so you always know what to do next—without daily monitoring.
All allocation decisions follow predefined rules, removing emotion and guesswork from the investment process.
During unstable periods, the model can shift toward safer funds like the G Fund and F Fund to help reduce major losses.
You stay in control of your account. The model provides the guidance — you implement the changes directly in your TSP.
See how federal employees and service members are using the TSP Allocation Model to take control of their retirement strategy
“I relied on the Lifecycle Funds for years, but it wasn’t maximizing my returns. The TSP Allocation Model showed me how to adjust my strategy, and I’m already seeing better results.”

David Harris
Civil Engineer, DOT
“After 30 years of federal service, I needed a plan to protect my TSP. This model has done that while keeping my savings growing. It’s allowing me to truly enjoy retirement.”

Rachel Stevens
Retired USPS Letter Carrier
“Call me crazy, but I hate talking to financial advisors. I have a hard time trusting their advice because of all the conflicts of interest. This model is perfect, it gives me everything I need to manage my TSP.”

Michael Cartier
Signals Intelligence Analyst, USMC
“I thought sticking with the G Fund was the safest choice, but I was barely keeping up with inflation. Now I’ve found a much better balance of security and growth. And my portfolio is finally growing!”

Darren Brown
Delivery Supervisor, USPS
“I used to worry every time the market dipped, afraid my TSP would take a hit. Now, I follow the model’s guidance and no longer stress over short-term swings. Okay, maybe I stress a little, but it’s a lot less!”

Alex Vaughn
Financial Analyst
“Following the TSP Model was the smartest decision I’ve made for my retirement. For the last 4 years my returns have consistently outperformed the market, and I feel confident that will continue.”

Rebecca Hollis
Retirement Benefits Specialist, VA
“I didn’t realize my TSP was underperforming until I used this model. Now, I have a structured approach that keeps my savings growing without requiring a lot of attention. I’m free to focus on work and family.”

Travis Colson
Petty Officer 2nd Class, U.S. Navy
“When I started my federal job, I had no idea how to invest my TSP. This model appears to be a simple, effective strategy and so far I have zero complaints.”

Liam Sun
File Clerk, HHS
“I used to second-guess every investment decision, constantly worrying if I was doing enough. This model gave me a plan I trust, and that’s been life-changing.”

Mason Everett
Aviation Mechanic, USCG
Designed for federal employees and military service members who want a smarter, more strategic way to manage their Thrift Savings Plan (TSP).

Get clear
recommendations across
the G, F, C, S, and I funds
without needing
investment experience.
Replace guesswork with a rules-based strategy that tells you exactly how to allocate each month.
A strategy built to shift toward safer funds during major downturns.

Updates take about 5
minutes a month. No
daily monitoring.
01
Visit our pricing page to choose the membership option that fits you best and begin your free month. Get instant access to the TSP Allocation Model and our other investment models.
02
On the last trading day of each month, you’ll receive the latest TSP Model allocation recommendations across the G, F, C, S, and I funds. Follow the step-by-step TSP Model Tutorial to implement the update correctly.
03
Monitor your portfolio using your TSP.gov account and track performance over time as you apply the model’s recommendations.
The TSP Allocation Model (TSP) is our premier Investment Model for Thrift Savings Plan investors. It’s designed to provide a complete portfolio management solution for people investing through their TSP accounts.
The TSP Model dynamically switches between the G, F, C, S and I funds to achieve outstanding returns while exposing your portfolio to significantly less risk than traditional investment approaches.
Any federal government employee or member of the uniformed services who has or is eligible for a TSP account will benefit from following the TSP Allocation Model. The TSP Model will help you keep your investments in sync with changing market conditions.
The TSP Model is a complete portfolio management solution, designed to manage your entire TSP account. If you’re new to Model Investing, consider using it for only a portion of your account to get started. As you become more confident in the TSP Model’s performance, you can begin using it to manage your entire account.
You can view the TSP Model’s historical backtested performance on the TSP Model Overview page. Pay special attention to the table of risk metrics as it’s important to understand that the TSP Model’s outperformance does not come as a result of taking on more risk. In fact, the TSP Model exposes your money to significantly less risk than traditional investment approaches.
The TSP Model uses a completely different approach to investing than traditional portfolio management. Instead of splitting your money between stocks and bonds and staying invested regardless of market conditions, the TSP Model tracks the performance of each of the TSP funds and allocates the portfolio accordingly, transitioning between funds as they take turns leading the way higher.
You can see the latest TSP Model recommendations on the current recommendations page. Access requires a premium subscription.
Using the TSP Model is simple. Each month you will receive an alert when the latest TSP Model recommendations have been posted. Simply log in to your TSP account and make the appropriate changes to your allocations. Click here to see the TSP Model Tutorial.
Yes. People are living longer these days and it’s important that your money continues to work for you during retirement. Because the TSP Model has been able to generate higher returns than both stocks and bonds, and also avoid major losses during market crashes, we feel comfortable recommending it to investors of all ages. For more information on how to de-risk your portfolio during retirement, please see this article.
With the TSP Allocation Model, you only need to review your allocations once per month. The model is designed to adapt to changing market conditions while keeping trading to a minimum. However, recommendations do not always change from month to month, so if the allocation remains the same, no action is required.
No. The Thrift Savings Plan will allow you to change your allocations free of charge.
The TSP Model is able to recognize developing periods of stock market weakness and will typically move the portfolio to the F Fund during the early stages of a crash. This limits losses and is one of the primary benefits of the TSP Model. When the stock market begins to recover, the TSP Model will move back into the C, S, and I Funds.
No. The TSP Model does not use the L Funds. Model Investing recommends that all investors avoid using target date funds due to their inherent problems.
The best TSP allocation depends on where we are in the economic cycle and whether conditions are improving or deteriorating. Generally speaking, during economic expansions the best funds to be in are the C, S, and I Funds. During recessions or periods of market turmoil, the G and F Funds will do a better job of protecting and growing your savings.
We offer a variety of other investment models for use in non-TSP accounts. If you’re investing through a 401(k), please see our 401(k) Allocation Model. For taxable accounts and those who do not have access to an employer-sponsored retirement plan, our Asset Rotation Model is the ideal solution. And for those who want to supplement their portfolio with a faster growth strategy, we offer the Sector Rotation Model.