A rules-based strategy that shifts between stock and bond funds in your 401(k) to
pursue stronger returns, manage volatility, and stay aligned with market conditions.
Over the past 26 years, it has outperformed the S&P 500, AGG (Bonds),
and a 60/40 portfolio.
The smartest thing I've done for my retirement.
— Jenny Foster, Patent Attorney

401(k) Model Quick links
401(k) investors who want to know exactly how to allocate their retirement plan each month.
The 401(k) Allocation Model helps investors optimize their employer-sponsored 401(k) plans by providing monthly allocation recommendations between stock and bond funds based on changing market conditions. It’s designed to pursue growth in stronger markets while shifting to safer funds during volatility.
Typical time to implement: 5-10 minutes
Recommendation frequency: Monthly
The 401(k) Allocation Model has consistently outperformed stock and bond benchmarks over the past 26 years, delivering higher compound returns than the S&P 500, AGG (Bonds), and a standard 60/40 mix, while cutting losses nearly in half during major market downturns. This performance is driven by the model’s rules-based approach to shifting allocations as market conditions change.
Backtested Performance (2000 - Present)
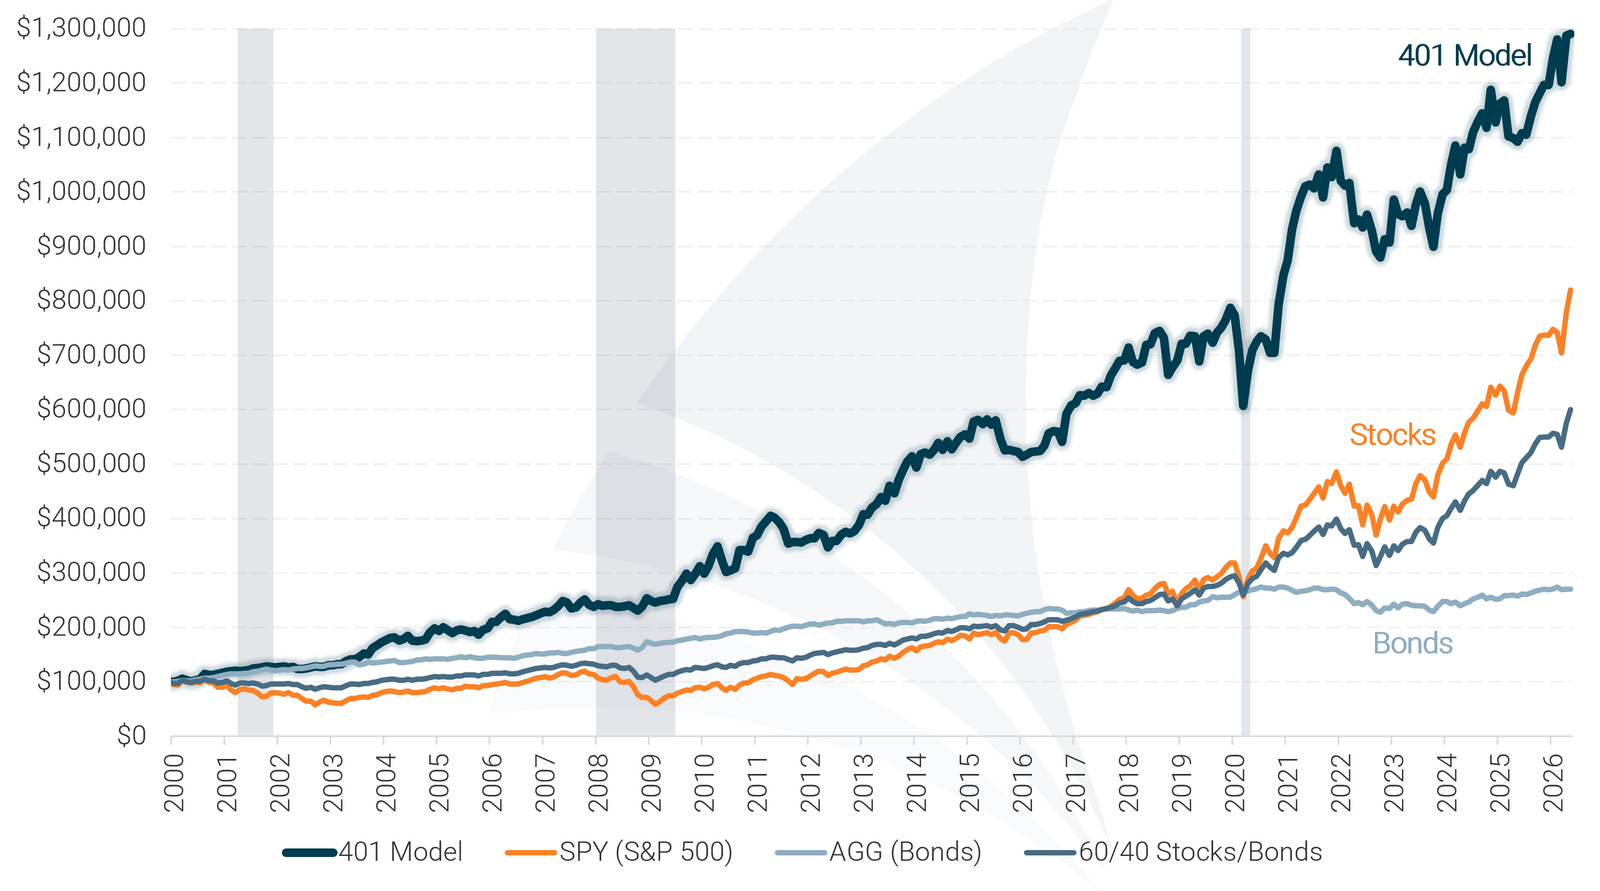
Model performance represents total returns and includes reinvestment of dividends and interest. No management fees or transaction costs are included. Historical performance is not an indication or guarantee of future performance.
Many 401(k) investors rely on static, age-based allocation rules — like target-date funds — that remain fixed regardless of what’s happening in the market. While simple, those approaches can drift out of alignment as conditions change. The 401(k) Allocation Model takes a different path, using a disciplined, rules-based process to shift between stock and bond funds based on current market conditions.
Rather than remaining locked into a preset allocation, the 401(k) Model adjusts positioning as market environments evolve. This helps keep your 401(k) aligned with prevailing trends while avoiding unnecessary risk or complexity.
Markets move through cycles. When conditions change, 401(k) allocations that remain static can become misaligned, either taking on more risk than intended or staying invested in weaker areas for too long.
The 401(k) Model helps you:
It’s proactive, easy to follow, and designed to deliver stronger results than static strategies — while keeping you in control of your retirement plan.

Stronger long-term growth without unnecessary swings
The 401(k) Model has historically delivered stronger long-term returns while experiencing less extreme ups and downs than individual stock funds or static allocations.

Smaller losses during major market downturns
Compared to staying fully invested in stocks or a 60/40 mix, the 401(k) Model has consistently experienced smaller declines during severe market downturns.

Faster recovery as markets improve
By shifting back toward growth-oriented funds as conditions strengthen, the 401(k) Model has historically recovered faster following periods of market weakness.
The table below provides additional detail for those who want a deeper look at the 401(k) Model’s historical performance. A plain-English explanation of these metrics is available, but it’s not required to follow and use the model.
| 401(k) Model Performance Metrics | ||||||||
|---|---|---|---|---|---|---|---|---|
| Strategy | Compound Annual Return | Alpha1 | Beta1 | Standard Deviation | Maximum Drawdown | Sharpe Ratio | Sortino Ratio | Treynor Ratio |
| 401 Model | 10.02% | 5.55% | 0.40 | 11.0% | -22.9% | 0.78 | 1.74 | 0.22 |
| SPY (S&P 500) | 7.99% | 0.00% | 1.00 | 17.9% | -50.8% | 0.43 | 0.48 | 0.08 |
| AGG (Bonds) | 3.88% | N/A | 0.00 | 4.8% | -17.1% | 0.43 | 0.51 | N/A |
| 60/40 Stocks/Bonds | 6.78% | 1.17% | 0.54 | 10.2% | -23.9% | 0.52 | 0.64 | 0.10 |
| Data for 26-Year Period (2000 – 2025) 1 Benchmarked against the S&P 500 |
||||||||
VIEW THE PLAIN-ENGLISH EXPLANATION OF THESE METRICS
The 401(k) Allocation Model follows a structured, rules-based process designed to keep your 401(k) aligned with changing market conditions without constant monitoring.
You don’t need to monitor markets, follow financial news, or make judgment calls.
Each month, the model evaluates the performance of stock and bond funds alongside current market
conditions.
Based on that analysis, the model determines the recommended allocation between stock and bond funds — shifting toward growth when conditions are favorable and toward safer funds when they’re not.
The model updates on a monthly schedule, keeping the process simple and avoiding unnecessary short-term changes.
You review the recommendation and make the changes directly in your 401(k) account. A step-by-step tutorial walks you through the process.
The 401(k) Model is designed to be practical, repeatable, and easy to follow. These features are built in — you just follow the monthly recommendation.
Clear monthly recommendations between stock and bond funds so you always know what to do next without daily monitoring.
All allocation decisions follow predefined rules, removing emotion and guesswork from the investment process.
During unstable periods, the model can shift toward bond and stable-value funds to help reduce major losses.
You stay in control of your account. The model provides the guidance — you implement the changes directly in your 401(k).
See how 401(k) investors are using the 401(k) Allocation Model to take control of their retirement strategy.
“Using the 401(k) Allocation Model has been a game changer for me. The returns I’ve achieved since following the model have consistently exceeded my expectations, and I finally feel confident about my path to retirement.”

Jon Peterson
Corporate Manager
“The Model Investing team even prepared a customized matching diagram for my 401(k) plan, making it easy to align their recommendations with my plan options. I’ve seen a huge improvement since making the switch.”

Patricia Collins
Director of Marketing
“I used to feel overwhelmed trying to decide how to allocate my 401(k) investments. The monthly updates from the 401 Model make everything so straightforward, and I’ve been thrilled with the results.”

Jason Lee
IT Specialist
“I was blindly following target-date funds, but they weren’t aggressive enough for my situation. This model gave me the strategy I needed to accelerate my savings.”

Derek Johnson
Logistics Manager
“I used to avoid looking at my 401(k) because I didn’t know what to do. Now, I check in with confidence, knowing I have a solid plan in place. The team was so helpful getting me up and running, especially Cara.”

Jenny Foster
Patent Attorney
“I was making all the classic mistakes – being too conservative when I was younger and too aggressive as I neared retirement. This model helped me adjust my strategy the right way.”

Jessica Ramirez
HR Manager
“I used to think maxing out my 401(k) was enough. That’s until I realized I was leaving thousands on the table by not optimizing my allocations. This model transformed my thinking and now I’m not just saving blindly.”

Sam Levy
Ph.D. Candidate, USC
“After following this model for a few years, my 401(k) is in the best shape of my life. I’m ready for retirement! The best part is knowing I’ll be able to leave more for my kids and help secure their future, too.

Carlos Navarro
Inventory Manager II
Designed for investors who want a smarter, more strategic way to manage their employer-sponsored 401(k) plan.

Get clear recommendations between stock and bond funds without needing investment experience.

Replace guesswork with a rules-based 401(k) strategy that tells you exactly how to allocate each month.

401(k) allocation strategy built to shift toward safer funds during major downturns.

About 5 minutes a month. No daily monitoring.
01
Visit our pricing page to choose the membership option that fits you best and begin your free month. Get instant access to the 401(k) Allocation Model and our other investment models.
02
Each month, you’ll receive the latest 401(k) Model allocation recommendations. Follow the step-by-step 401(k) Allocation Model Tutorial
to implement the update correctly.
03
Monitor your portfolio using your 401(k) provider’s online portal and track performance over time as you apply the model’s recommendations.
The 401(k) Allocation Model (401) is our premier investment model for 401(k) investors. It’s designed to provide a complete portfolio management solution for people investing through their employer-sponsored 401(k) plans.
The 401 Model actively adjusts between stock and bond funds based on market conditions. It shifts into high-growth investments during strong markets and moves to safer assets when risks increase, helping your portfolio stay ahead of market changes.
Anyone who invests through a 401(k) plan will benefit from following the 401(k) Allocation Model. The 401 Model will help you keep your investments in sync with changing market conditions.
The 401 Model is a comprehensive portfolio management solution designed to manage your entire 401(k) account. If you’re new to Model Investing, you may start by allocating only a portion of your account. As you gain confidence in the 401 Model’s performance, you can gradually transition to using it for full account management.
You can review the 401 Model’s historical backtested performance on the 401 Model Overview page. Be sure to check the risk metrics table, which highlights how the 401 Model’s strong performance is achieved without taking on additional risk. In fact, it reduces risk exposure compared to traditional investment strategies.
The 401 Model takes a fundamentally different approach to investing than traditional portfolio management. Rather than maintaining a fixed split between stocks and bonds regardless of market conditions, it actively monitors the performance of various stock and bond funds and adjusts allocations accordingly, shifting into the strongest-performing funds as market trends evolve.
You can see the latest 401 Model recommendations on the current recommendations page. Access requires a premium subscription.
The 401 Model is simple to use. First, you’ll need to identify which funds in your 401(k) plan align with those in the 401 Model – but don’t worry, this is a one-time setup, and we’ll take care of it for you. After that, you’ll receive a monthly alert when new 401 Model recommendations are available. Just log in to your account and update your allocations accordingly. For more information please see the 401 Model Tutorial.
Yes. People are living longer these days and it’s important that your money continues to work for you during retirement. Because the 401 Model has been able to generate higher returns than both stocks and bonds, and also avoid major losses during market crashes, we feel comfortable recommending it to investors of all ages. For more information on how to de-risk your portfolio during retirement, please see this article.
The 401(k) Allocation Model requires updates once per month to keep your portfolio aligned with market trends. Since the model is designed to limit unnecessary trades, your allocations may stay the same for multiple months. If there is no change in the recommendation, you can leave your investments as they are.
In general, no. Your 401(k) plan should allow you to make changes to your investment allocations free of charge as long as you do not violate your plan’s excessive trading policy. You should research your specific plan’s policy regarding this before beginning to use the 401 Model. Learn More
The 401 Model is able to recognize developing periods of stock market weakness and will typically move the portfolio to bonds during the early stages of a crash. This limits losses and is one of the primary benefits of the 401 Model. When the stock market begins to recover, the 401 Model will move back into stocks.
No. The 401 Model does not use target date funds. Model Investing recommends that all investors avoid using target date funds due to their inherent problems.
The best allocation for your 401(k) depends on where we are in the economic cycle. During expansions, stock funds typically offer the highest growth. In recessions or market downturns, bond and stable-value funds provide better protection. The 401 Model adjusts dynamically to keep your portfolio optimized.
We offer a variety of investment models for use outside of employer-sponsored 401(k) plans. If you’re a federal government employee or part of the military, please see our TSP Allocation Model. For taxable accounts, IRAs, and 529 plans, we recommend the Asset Rotation Model. And for investors looking for maximum growth we offer the Sector Rotation Model.