A rules-based, low-turnover investment strategy that rotates between stocks and bonds to manage risk, improve long-term returns, and enhance tax efficiency.
26+ years of historical performance vs SPY, AGG, and a 60/40 portfolio.
I wish I'd started following this years ago.
— Gerald Sutton,Retiree
ARM Quick links
ARM investors who want a low-turnover, rules-based strategy across stocks and bonds.
The Asset Rotation Model (ARM) helps you grow wealth outside your 401(k) or TSP by evaluating market conditions each month and signaling whether to hold stocks or bonds.
ARM is designed to be simple to follow with scheduled adjustments rather than constant monitoring or trading.
Typical time to implement: 5–10 minutes
Recommendation frequency: Monthly
The Asset Rotation Model has consistently outperformed traditional stock and bond benchmarks over the past 26 years, delivering higher compound annual returns than the S&P 500, AGG (Bonds), and a standard 60/40 mix, while cutting losses nearly in half during major market downturns. This performance is driven by the model’s rules-based approach to rotating between stocks and bonds as market conditions change.
Backtested Performance (2000 - Present)
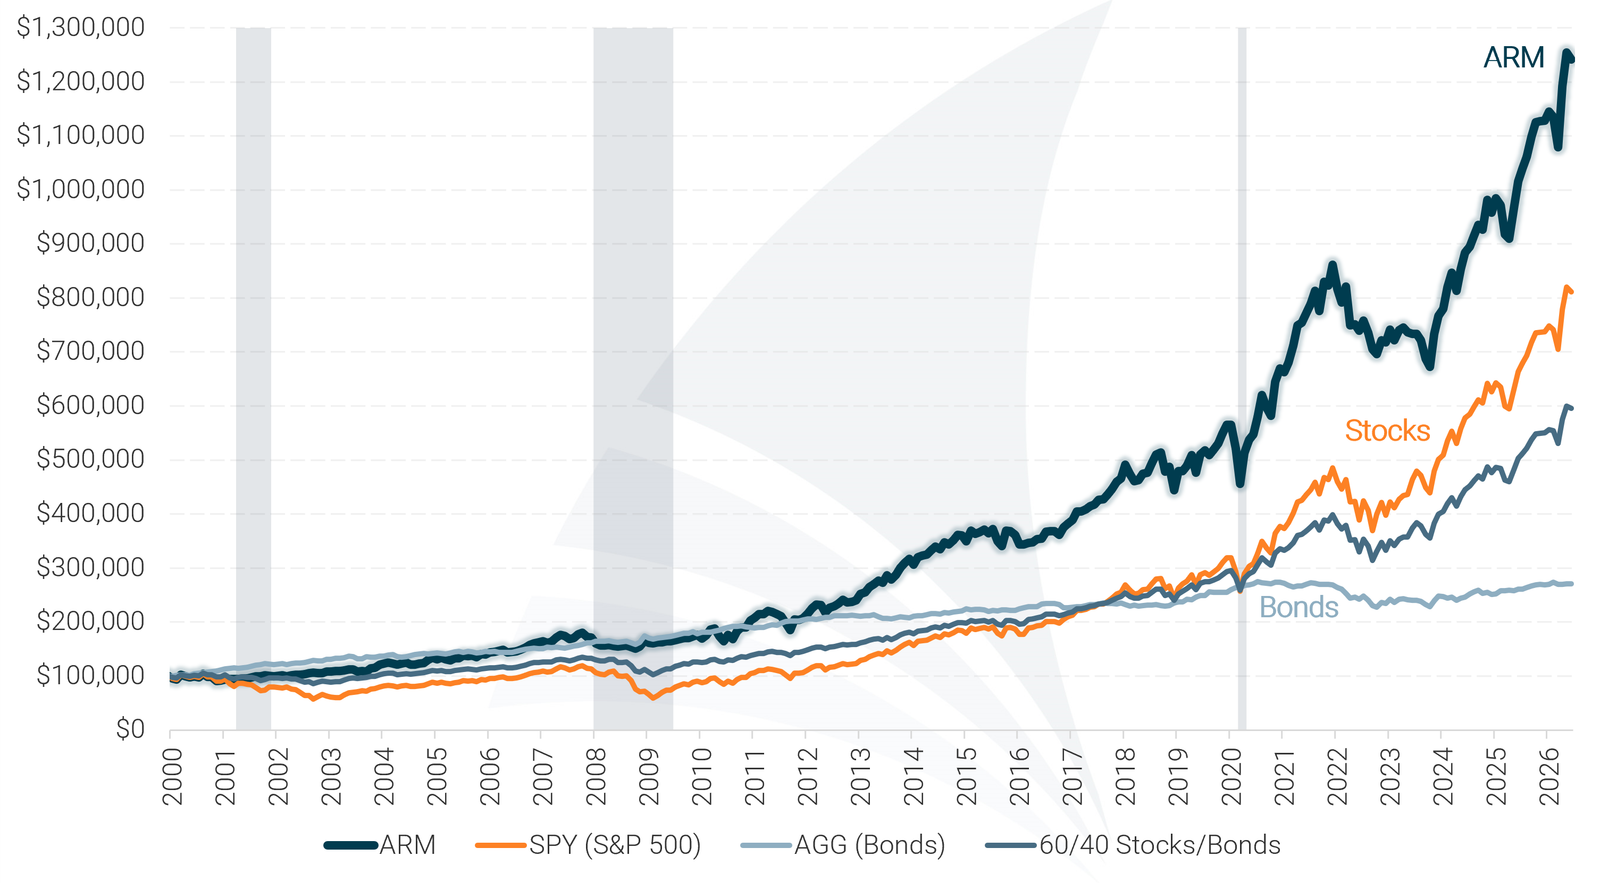
Model performance represents total returns and includes reinvestment of dividends and interest. No management fees or transaction costs are included. Historical performance is not an indication or guarantee of future performance.
Many investors rely on static, age-based allocation rules that remain fixed regardless of what’s happening in the market. While simple, those approaches can drift out of alignment as conditions change. The Asset Rotation Model (ARM) takes a different path—using a disciplined, low-turnover process to rotate between stocks and bonds based on current market conditions.
Rather than remaining locked into a preset allocation, ARM adjusts exposure as market environments evolve. This helps keep portfolios aligned with prevailing trends while avoiding unnecessary trading or complexity.
Markets move through cycles. When conditions shift, portfolios that remain static can take on more risk than intended or stay exposed to underperforming assets for too long. ARM is designed to respond to those changes in a structured, repeatable way—without the demands of active trading.
ARM helps investors:
Because ARM is designed with low turnover in mind, it can also help reduce short-term capital gains taxes—making it particularly well-suited for taxable accounts, IRAs, Roth IRAs, HSAs, and 529 plans.
Stronger long-term results without excessive swings
ARM has historically delivered excellent long-term returns while experiencing less extreme ups and downs than traditional buy-and-hold portfolios.
Smaller losses during major market downturns
Compared to buy-and-hold strategies, ARM has Consistently experienced smaller declines during severe market selloffs.
Quicker recovery after market declines
By adjusting exposure as market conditions improve, ARM has historically rebounded faster following periods of market weakness.
The table below provides additional detail for those who want a deeper look at ARM’s historical performance.
A plain-English explanation of these metrics is available, but it’s not required to use the model.
| Asset Rotation Model (ARM) Performance Metrics | ||||||||
|---|---|---|---|---|---|---|---|---|
| Strategy | Compound Annual Return | Alpha1 | Beta1 | Standard Deviation | Maximum Drawdown | Sharpe Ratio | Sortino Ratio | Treynor Ratio |
| ARM | 9.77% | 4.56% | 0.51 | 11.7% | -21.9% | 0.72 | 1.25 | 0.17 |
| SPY (S&P 500) | 7.99% | 0.00% | 1.00 | 17.9% | -50.8% | 0.43 | 0.48 | 0.08 |
| AGG (Bonds) | 3.88% | N/A | 0.00 | 4.8% | -17.1% | 0.43 | 0.51 | N/A |
| 60/40 Stocks/Bonds | 6.78% | 1.17% | 0.54 | 10.2% | -23.9% | 0.52 | 0.64 | 0.10 |
| Data for 26-Year Period (2000 – 2025) 1 Benchmarked against the S&P 500 |
||||||||
View the plain-English explanation of these metrics
The Asset Rotation Model (ARM) follows a structured, rules-based process designed to keep portfolios aligned with changing market conditions without constant monitoring or frequent trading.
You don’t need to monitor markets, follow financial news, or make judgment calls.
ARM evaluates market conditions using predefined indicators to determine whether stocks or bonds are favored.
Based on those conditions, ARM determines the appropriate allocation between stock and bond assets.
ARM updates its allocation signals on a monthly schedule, helping avoid unnecessary short-term trading.
You simply review the updated allocation and implement it directly in your own account.
ARM is designed to be practical, repeatable, and manageable for long-term investors. These features are built in, you just follow the monthly recommendation.
ARM is designed to limit unnecessary trading, helping reduce transaction costs and support tax efficiency in taxable accounts.
All allocation decisions follow predefined rules, removing emotion and guesswork from the investment process.
Signals update on a predictable monthly schedule, eliminating the need for constant monitoring or rapid decision-making.
You stay in control — ARM provides the allocation guidance, and you place trades directly in your own account.
See how everyday investors are using the Asset Rotation Model to transform their portfolios:
“Switching to the Asset Rotation Model has been one of the best decisions I’ve made. It’s perfect for my taxable accounts because the low-turnover strategy minimizes short-term capital gains taxes.”

Michael Davis
Owner of Vetra LLC
“The ARM has been a lifesaver for my 529 plan. Since the plan limits how often I can make changes, the model’s approach fits perfectly. I’m confident my child’s education fund is in good hands with this strategy.”

Emily Chen
Working Mom
“Without access to an employer-sponsored retirement plan, I struggled to find a reliable way to save for retirement. The Asset Rotation Model fixed that. It’s become the backbone of my investment plan.”

Laurel Thompson
Digital Marketing Freelancer
“I was skeptical at first, but the Asset Rotation Model has really impressed me. It keeps my portfolio aligned with market trends without me having to constantly watch the market. Simple to follow and has delivered great results so far!”

Maren Winslow
Ethics Consultant
“After using the Asset Rotation Model for a few months, I can say it really works. It takes the stress out of deciding where to invest and keeps my portfolio on track without me having to constantly monitor the market. Wish I had found this sooner!”

Brent Calloway
UX Researcher
“I love that this model is based on data, not emotions. It keeps me disciplined and ensures I stay invested in the right assets over the long run.”

Aisha Nair
Sr. Software Engineer
“I needed a strategy that would help me preserve my retirement savings while still generating returns. This model has provided just that, giving me peace of mind.”

Gerald Sutton
Retiree
ARM is designed to fit a variety of investing goals and experience levels.

ARM gives you structure, removes guesswork, and helps you stay consistent month to month.

ARM is designed to be simple and low maintenance. You don’t need to watch the market daily.

ARM focuses on risk aware allocation changes, aiming to reduce exposure during unfavorable market conditions.

ARM is built to support taxable accounts and other non-employer plans where tax efficiency and practicality matter.
01
Visit our pricing page to explore membership options and begin your free trial (no upfront charges or commitment required). Get instant access to ARM tools and strategies.
02
Once enrolled, you’ll receive clear monthly updates with allocation recommendations. Follow the step-by-step ARM Tutorial to implement.
03
Track performance through your investment account’s online portal and compare results to benchmarks over time.
The Asset Rotation Model (ARM) is our premier investment strategy, offering a complete portfolio management solution for investors looking to grow wealth beyond employer-sponsored plans like 401(k)s and the Thrift Savings Plan. Designed for dynamic market conditions, the ARM helps you maximize returns while managing risk with precision.
The ARM dynamically adjusts between stocks and bonds, optimizing returns while significantly reducing risk compared to traditional investment strategies. By adapting to changing market conditions, it keeps your portfolio positioned for growth and stability in any environment.
The ARM is perfect for investors managing assets outside employer-sponsored retirement plans like a 401(k) or TSP. With low turnover, it’s an excellent choice for taxable accounts, IRAs, 529 plans, and HSAs. If your 401(k) offers a brokerage option, you may benefit from following the ARM instead of the 401 Model to maximize flexibility and returns.
The Asset Rotation Model is built to be the foundation of your investment portfolio, delivering strong performance with a low-risk profile. By allocating the majority of your investments to the ARM, you create a stable core, allowing you the flexibility to take a more speculative approach with your remaining funds.
You can explore the ARM’s historical backtested performance on the ARM Overview page, with a detailed breakdown of key risk metrics. Pay close attention to these figures – the ARM’s superior returns aren’t the result of taking on more risk. In fact, the model strategically reduces risk exposure while outperforming traditional investment approaches.
The ARM takes a radically different approach to investing compared to traditional portfolio management. Instead of maintaining a fixed stock-and-bond allocation regardless of market conditions, the ARM dynamically shifts between stocks and bonds – strategically positioning your portfolio based on current market trends and future performance expectations.
You can view the latest ARM recommendations on the current recommendations page. A premium subscription is required for access.
Using the ARM is simple. Each month, you’ll receive an alert when the latest ARM recommendations are posted. Just log in to your brokerage account and update your investments accordingly. For step-by-step guidance, see the ARM Tutorial.
Yes. With longer life expectancies, it’s crucial that your money keeps working for you in retirement. The ARM has historically outperformed both stocks and bonds while avoiding major losses during market downturns, making it a strong choice for all investors. For strategies to de-risk your portfolio in retirement, see this article.
With the Asset Rotation Model (ARM), you only need to update your asset allocations once per month. The model is designed to minimize trading while keeping your portfolio aligned with current market conditions. However, allocations do not always change from one month to the next, so if the recommendation remains the same, no action is needed.
Most likely, no. The ARM is designed to use low-cost ETFs and minimize trades each year, keeping expenses low. Plus, most brokerage accounts no longer charge commissions on trades, making it even more cost-effective. Over time, reducing costs can have a significant impact on your investment growth.
The ARM detects early signs of stock market weakness and typically shifts the portfolio to bonds at the onset of a downturn, limiting losses. This defensive approach is one of the ARM’s key benefits. When the market rebounds, the model reallocates back into stocks.
Yes, the ARM provides indirect international exposure when invested in stocks. It does this by using the SPY ETF, which tracks the S&P 500. Since S&P 500 companies generate between one-third and one-half of their revenue from overseas, the ARM indirectly benefits from global market growth.
The best asset allocation strategy is one that adapts to changing market conditions while balancing growth and risk. Unlike traditional strategies that maintain a fixed allocation between stocks and bonds, the Asset Rotation Model (ARM) dynamically shifts between the two based on market trends and future performance expectations.