Whether we like it or not, the value of our portfolios depends heavily on the behavior of financial markets, which, in turn, are intertwined with the economy. Therefore, how and where we invest are dictated in large part by our expectations of future economic growth.
Generally speaking, when the economy is growing (expanding), stock prices tend to offer the highest returns to investors. This is because during economic expansions, corporations are able to sell more goods and services, which increases their overall earnings. Since a share of stock is simply a share in the future earnings stream of a company, share prices rise as expected earnings rise.
The problem, however, is that the economy doesn’t grow in a straight line. Instead, it oscillates above and below it’s long-term growth rate. When the economy begins to contract, and we enter a recession, stock prices typically collapse in value. As a result, understanding the changing nature of our economy is of critical importance to managing your portfolio.
Cyclical vs. Structural Growth
When it comes to the economy, there are both cyclical and structural forces at play. Cyclical forces are caused by short-term developments (such as tax cuts or policy rate changes), while structural forces are the result of underlying long-term fundamentals such as the labor force growth rate.
Cyclical factors will always cause the economy to ebb and flow, but a sound understanding of the structural backdrop is critical in developing a longer-term outlook, and being able to understand the potential effects of those cyclical swings.
To get started, the first thing we need to understand is that economic growth in the U.S. is slowing. As you can see in the chart below, each expansion over the last five decades has been accompanied by a slower growth rate. The current expansion isn’t quite in the books yet, but it’s fair to assume this trend will continue.
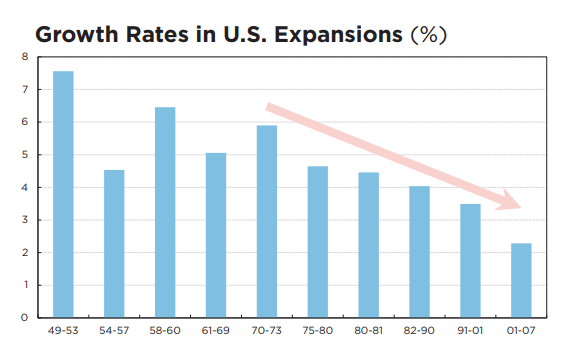
This chart is a bit unnerving for those of us here in the States, but as we’ll soon see, this problem is much more widespread. It’s not just the U.S. economy that’s slowing, ALL major developed countries around the globe are exhibiting this same trend.
Forecasting Economic Growth
Our economy is incredibly complex, but we can actually forecast economic growth from just two variables: the labor force growth rate, and the productivity growth rate. In order for the economy to grow, either more people must be working (growing labor force), or those workers must kick out increased output (higher productivity). The sum of these two growth rates equals the growth rate of the economy.
In the chart below (courtesy of ECRI), we can see the historical trends for each of these metrics. The top panel shows us the growth rate in labor productivity, and the lower panel highlights the changing growth rate of the U.S. labor force.
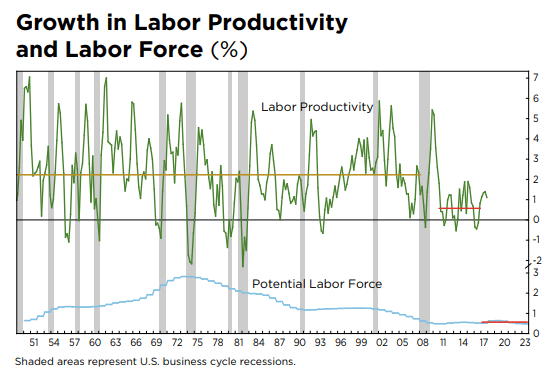
There are two important takeaways from this chart. First, notice the short horizontal red line in the top panel. This represents the average productivity growth rate during the current expansion, which is roughly 0.5%. In the lower portion of the chart, we also see a horizontal red line, and in this case the line represents the Congressional Budget Office’s estimate for labor force growth over the next six years (also about 0.5%).
Since labor force growth is primarily a function of demographics, it’s relatively easy to forecast and subject to little volatility. And because labor force growth is set in stone many years out, the conversation about economic growth necessarily revolves around productivity growth. If the U.S. can’t figure out a way to drive up the output per worker, then total output is likely to grow at a very slow rate.
In fact, taking these figures together, we can surmise that (absent any cyclical factors), the U.S. economy is likely to grow at about 1% per year moving forward. But as mentioned earlier, it’s not just the U.S. that’s facing this predicament.
All Major Economies Are Flatlining
If we perform a similar analysis of the other G7 countries, we find a strikingly similar pattern. This worldwide trend toward lower economic growth can be seen in the following chart, which is also courtesy of ECRI. This chart is a bit tricky to read, so let’s examine it in detail.
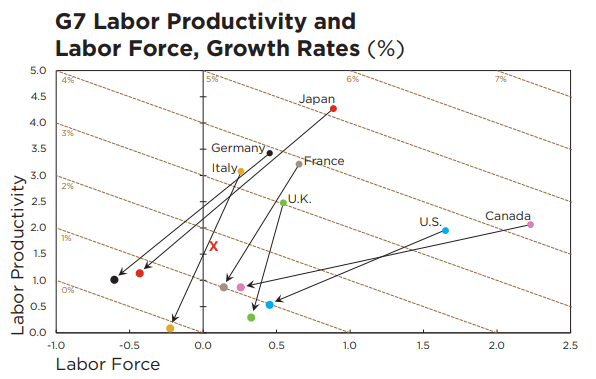
Along the Y-axis of this chart we have labor productivity growth, and along the X-axis we have labor force growth. Since overall economic growth is simply the sum of these two growth rates, the diagonal downward sloping dashed lines represent various levels of economic growth.
As for each country’s arrow, these are denoted using the 1957 – 2007 average (for both productivity growth and labor force growth) as the starting point. Each country’s ending coordinate is then determined using average productivity growth over the past six years and potential labor force growth over the next six years.
Based on the arrows, it should be clear that all G7 countries are seeing sustainably lower levels of both productivity and labor force growth, and are converging to around 1% GDP growth. As you can imagine, this has some important implications.
Get Ready for More Recessions
It shouldn’t take an economist to tell you that 1% GDP growth is very close to 0%, which is the dividing line between expansion and contraction. Also, as alluded to earlier, the economy rarely tracks its long-term growth rate but rather oscillates above and below it.
As a result, perhaps the biggest takeaway from this exercise is the notion that moving forward, we’re likely to experience much more frequent recessions. Recessions are typically defined as two consecutive quarters of falling GDP, an occurrence that’s bound to happen much more often in a low/no growth environment.
If the U.S. and other G7 economies can’t figure out a way to boost productivity, then we need to embrace this shift. It’s going to represent a major change from the higher growth periods earlier in history, and will have major implications for nearly all asset classes.
Understanding the Impact on Asset Prices
Without getting too far into the weeds, we can make some inferences as to how this low growth environment will affect asset prices. Perhaps one of the most affected areas will be that of interest rates.
Over the long run, the yield on the 10-year Treasury note – considered a bellwether for the U.S. economy since it’s used as a benchmark for many other types of debt – generally tracks the sum of real GDP growth and inflation. If real GDP growth converges toward 1% and inflation remains near the Federal Reserve’s target of 2%, then the yield on the 10-year note should remain close to 3%.
That’s very close to where it sits now, and suggests that this low interest rate environment is here to stay. That’s generally good for borrowers and bad for lenders, but it also carries some additional implications.
The value of stocks is largely a function of the cost of money, which, as you can probably guess, depends on the prevailing level of interest rates. Lower interest rates therefore suggest that market multiples (P/E ratios) will continue to remain elevated, as they have for the last couple of decades.
That may sound good in theory, but lackluster economic growth will also prohibit companies (in aggregate) from expanding at the rates they have historically. With the total pie showing little growth, companies will have to grow by taking market share. That suggests a more cutthroat environment, with size and scale playing an increasingly important role.
Finally, we all know that recessions are accompanied by dramatic swings in stock prices. If we do enter a period of more frequent recessions, it means that market volatility is bound to increase. As a result, investors will have to take a more active role in managing their portfolios. Simply buying and holding stocks in this environment will not produce the results investors have achieved historically, since the tailwind of strong economic growth will soon be nothing more than a gentle breeze.

An innovative approach for eaming higher returns with less risk
Download Report (1.2M PDF)You don’t want to look back and know you could’ve done better.
See Pricing