

Want a rules-based plan for market downturns?
Model Investing’s 401(k) and TSP Allocation Models use a rules-based approach designed to reduce exposure during
weaker market conditions and re-engage when conditions improve.
Ready to raise your investing IQ?
Sign up for our Free Newsletter to access the best investment information money can’t buy.

Published On: June 4, 2026
Last Updated: June 11, 2026
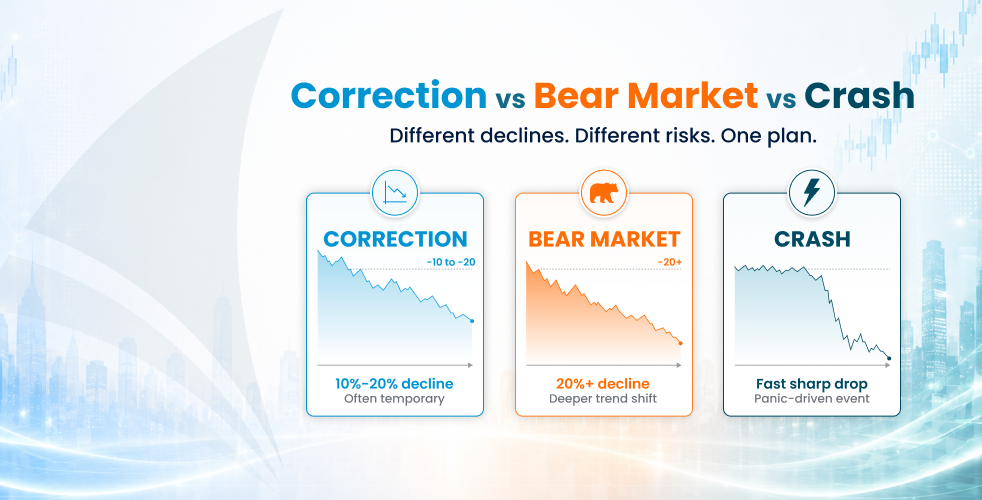
When markets fall, three different terms get used as if they mean the same thing:
correction, bear market, and crash. They don’t. Each has a specific definition, a different historical pattern, and
a very different implication for your portfolio.
Knowing which one you’re in matters. A correction usually resolves in months, but a bear
market can take years to recover from. A crash can wipe out a year of gains in days. This article breaks down what
each term actually means, how often they happen, how long they last, and what the historical data says about how to
respond.
Key Takeaways
Here’s the short version. All three measure how far the market has fallen from its most
recent peak, but the differences come down to depth, speed, and duration.
| Aspect | Correction | Bear Market | Crash |
|---|---|---|---|
| Size of decline | 10% to 20% | 20% or more | No fixed threshold |
| Typical duration | 3–4 months | 9–10 months (average) | Days to weeks |
| How fast | Gradual | Gradual to fast | Very fast |
| Frequency | Every 1–2 years | Every 3.5 years | Rare |
| Usually triggers | Sentiment shift | Recession, policy shock | Panic, shock event |
| Example | S&P 500, Feb to Apr 2025 (-18.9%) | 2022 bear market (-25.4%) | March 2020 (-33.9% in 33 days) |
Sources: Charles Schwab Center for Financial Research, Morningstar, FINRA, Yardeni Research, Hartford Funds.
A correction is a decline of more than 10% but less than 20% from a recent market high.
The 10% threshold is widely accepted across major institutions, including Schwab, Morningstar, FINRA, and Fidelity.
The term applies when the S&P 500 (or another broad index) closes at least 10% below its most recent
peak.
Corrections are common. The S&P 500 has experienced at least 10 corrections since
the year 2000. Historically, they last about three to four months on average and end either when the market rebounds
back toward its previous high or, in some cases, when the decline deepens past 20% and reclassifies as a bear
market.
The most recent example: the S&P 500 fell 18.9% from February 19, 2025, to April 8,
2025, driven by tariff uncertainty and policy shocks. It set a new all-time high on June 27, 2025, marking the end
of the correction. Total duration: about four months from peak to recovery.
Corrections often come from sentiment shifts
rather than fundamental economic damage. Common triggers include unexpected policy announcements, geopolitical
events, earnings disappointments, or sudden changes in interest rate expectations. They tend to feel scary while
happening but rarely signal lasting economic weakness.
A bear market is a sustained market decline of 20% or more from a recent peak. The 20%
threshold separates a normal correction from a more serious downturn that usually reflects deeper economic problems.
Once the S&P 500 closes 20% below its recent high, the decline is generally classified as a bear market. The
market is often considered to have entered a new bull phase after rising 20% from its bear-market low, though full
recovery requires returning to the prior high.
Bear markets are less frequent than corrections but more damaging. Since 1928, the
S&P 500 has experienced 27 bear markets, or roughly one every 3.5 years. The average decline is about 35%, and
the average duration is 289 days (about 9.6 months), according to data from Hartford Funds.
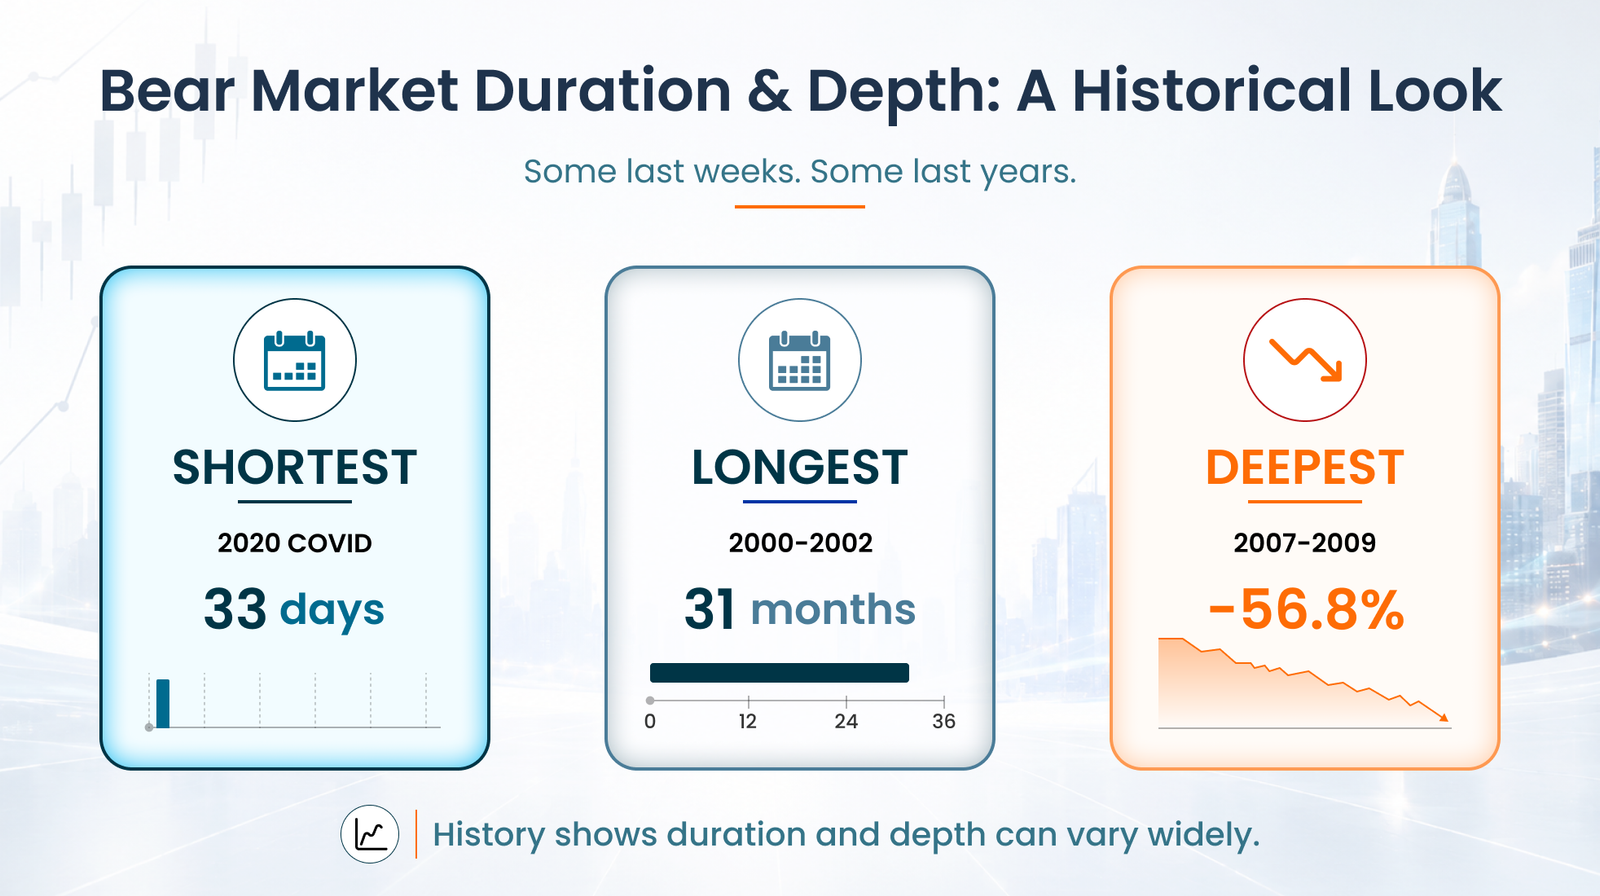
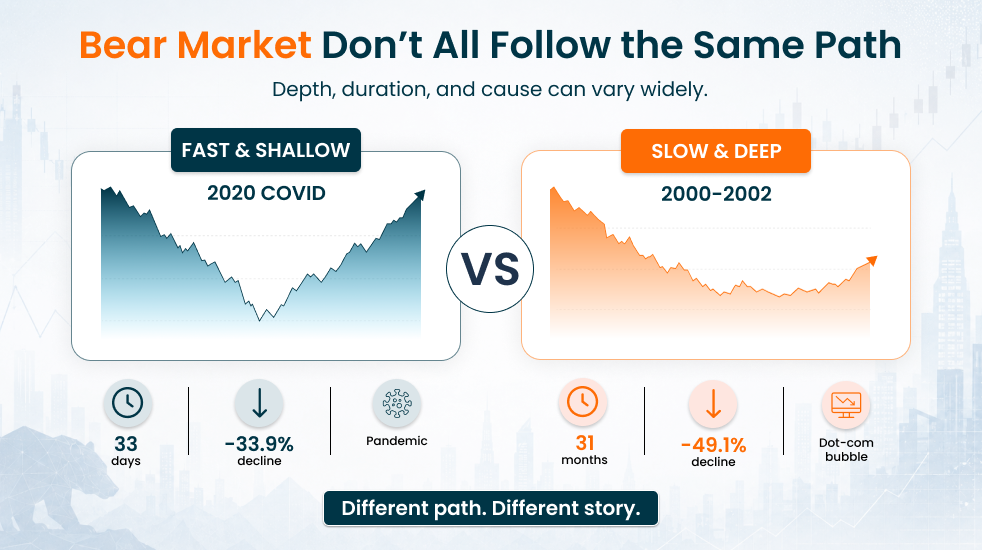
However, those averages hide enormous variation. The 2020 COVID bear market lasted just
33 days. The 1973–1974 bear market lasted 21 months. Bear markets that coincide with recessions tend to be
significantly worse: they average around 30% to 35% declines and last close to 400 days, compared to non-recession
bears that average shallower losses and shorter durations.
The honest answer is that duration is hard to predict in advance. Looking at the seven
major bear markets since 1973:
The pattern: recession-paired bear markets tend to be longer and deeper. Non-recession
bears, including 1987 and 2022, tend to resolve faster but can still be sharp.
A crash is a sudden, sharp market drop that happens over days or weeks. Unlike
corrections and bear markets, crashes are defined more by speed and panic than by a precise percentage
threshold.
The most famous historical crashes include Black Monday on October 19, 1987 (the Dow
lost 22.6% in a single day), the dot-com crash starting in March 2000, the 2008 financial crisis crash, and the
COVID-19 crash of March 2020, which saw the S&P 500 fall 33.9% in just 33 days, the fastest bear market in
history.
A crash can be the opening phase of a bear market or just a sharp panic-driven dip
within a correction. The 1987 crash, for instance, dropped the S&P 500 by over 33%, but the market recovered
within months. The 2008 crash kicked off a 17-month bear market that took years to fully recover from. Same event
type, very different consequences.
Looking at the modern era of bear markets reveals important patterns about depth,
duration, and recovery.
| Bear Market | Decline | Duration | Primary Cause |
|---|---|---|---|
| 1973–1974 | Down 48.2% | 21 months | Oil crisis, stagflation |
| 1980–1982 | Down 27.1% | 20 months | Fed rate hikes, recession |
| 1987 (Black Monday) | Down 33.5% | 3 months | Programmatic selling, panic |
| 2000–2002 (Dot-com) | Down 49.1% | 31 months total | Tech bubble, 9/11 |
| 2007–2009 | Down 56.8% | 17 months | Subprime mortgage crisis |
| 2020 COVID | Down 33.9% | 33 days | Pandemic shutdown |
| 2022 | Down 25.4% | 9 months | Inflation, Fed tightening |
Sources: Yardeni Research, Schultz Collins, S&P Dow Jones Indices,
FactSet.
Three takeaways stand out:
The right response depends on what type of decline you’re facing and how your portfolio
is structured. Here’s what the historical data supports for each scenario:
Most corrections resolve within a few months. The data suggests staying the course in
this scenario is usually correct for long-term investors. Selling during a 10% to 20% decline often means missing
the recovery, since corrections frequently end as abruptly as they begin. Roughly 80% of corrections never turn into
bear markets.
However, corrections can be a useful signal to review your allocation. If a 15% drop
feels unbearable, your portfolio may be too aggressive for your time horizon and risk tolerance. Adjust during
normal markets, not during the decline itself.
This is where allocation decisions matter most. A 30% to 50% drawdown late in someone’s
working years can materially delay retirement if the portfolio is not positioned to recover. Three actions
consistently help:
Crashes are extremely difficult to respond to in real time because they happen too fast.
By the time most investors notice, the worst is often already priced in. The 1987 and 2020 crashes both rebounded
sharply within months, punishing investors who panic-sold.
This is why having a pre-defined plan matters more than reacting in the moment. A
rules-based strategy that knows in advance how to respond to specific market conditions removes the need for
emotional decisions during a crash.
Model Investing’s 401(k) and TSP Allocation Models use a rules-based approach designed to reduce exposure during
weaker market conditions and re-engage when conditions improve.
Traditional advice (buy and hold, stay the course, ride it out) works reasonably well
over 30-year time horizons but can be challenging for anyone within 5–15 years of retirement. A 50% bear market
drawdown at age 60 can materially delay retirement if the portfolio is not positioned to recover.
Tactical asset
allocation takes a different approach. Instead of staying fully invested through every
downturn, it uses defined rules to shift between stock and bond funds based on current market conditions. The goal
is to capture growth in expansions and reduce exposure when conditions deteriorate.
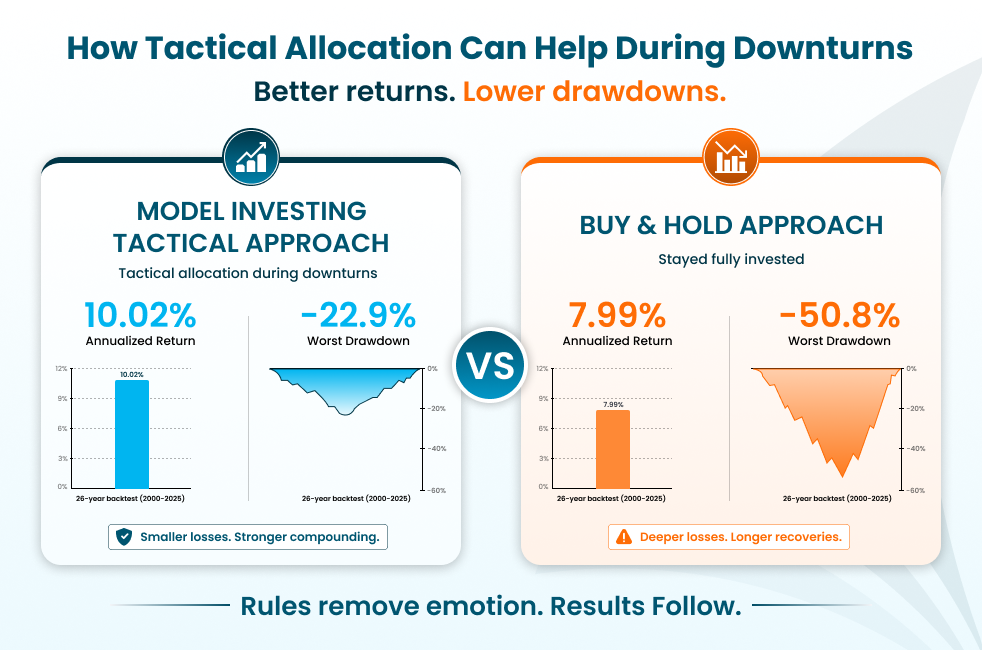
Over a 26-year backtest covering the dot-com bear market, the 2008 financial crisis, the
2020 COVID crash, and the 2022 bear market, this approach has historically outperformed both the S&P 500 and a
static 60/40 portfolio while limiting drawdowns:
| Strategy | 26-Year Annual Return | Worst Drawdown |
|---|---|---|
| S&P 500 | 7.99% | Down 50.8% |
| 60/40 (stocks and bonds) | 6.78% | Down 23.9% |
| 401(k) Allocation Model |
10.02% | Down 22.9% |
| TSP Allocation Model |
9.73% | Down 22.8% |
| Disclosure: Backtested performance is hypothetical and does not guarantee future results. Past performance is not an indication of future results. Sources: Model Investing 401(k) and TSP Allocation Model performance metrics (2000–2025). |
In the backtest, the 401(k) Allocation Model
returned 10.02% annually over 26 years, compared with 7.99% for the S&P 500, while limiting the worst drawdown
to 22.9% versus the S&P’s 50.8% loss in 2008. The TSP Model produced similar results within the constraints of
the federal TSP fund menu.
Model Investing offers four rule-based
strategies, each designed for a different kind of retirement account. Whether you’re managing a
workplace 401(k), a federal TSP,
an IRA, a taxable brokerage account, or all of the above, there’s a model designed for that account type. One
subscription gives you access to all four.
Corrections, bear markets, and crashes are different events with different implications.
A correction is a normal, often healthy part of investing. A bear market is a longer test of patience and allocation
discipline. A crash is a sudden shock that punishes both panic-sellers and unprepared portfolios.
Across all three, the investors who do best aren’t the ones who got lucky on timing.
They’re the ones who had a process in place before the decline started. Whether you’re managing a 401(k), a TSP, or
any other retirement account, the most important question isn’t when the next downturn will happen. It’s whether
your portfolio is built to handle it when it does.
Model Investing offers four rules-based strategies, one for every kind of retirement account. One
subscription gives you access to all of them.
A correction is a decline of more than 10% but less than 20% from a recent market high. A bear market is a decline of 20% or more. Both measure peak-to-trough losses, but bear markets are deeper, usually last longer, and often coincide with recessions or other economic stress. Roughly 80% of corrections never become bear markets.
A crash is a sudden, sharp market drop that happens over days or weeks. Unlike corrections and bear markets, crashes are defined more by speed and panic than by a precise percentage threshold. Famous examples include Black Monday in 1987 (Dow down 22.6% in a single day) and the March 2020 COVID crash (S&P 500 down 33.9% in 33 days).
A bear market is defined as a sustained decline of 20% or more in a broad stock market index from its most recent peak. Bear markets often (but not always) coincide with recessions. They tend to last longer and cut deeper than corrections. The average bear market since 1928 has lasted about 9.6 months with a 35% peak-to-trough decline.
On average, bear markets last about 9.6 months (289 days), but the range is wide. The 2020 COVID bear market lasted just 33 days. The 1973–1974 bear market lasted 21 months. Bear markets paired with recessions tend to last close to 400 days on average, while non-recession bears tend to resolve faster.
Since 1928, the S&P 500 has experienced 27 bear markets, or roughly one every 3.5 years. Corrections are even more frequent, with the S&P 500 having experienced at least 10 corrections since the year 2000 alone.
A correction is defined by depth (a decline of more than 10% but less than 20% from peak), while a crash is defined by speed (a large drop happening in days or weeks). A correction can happen gradually over months. A crash, by definition, happens quickly. A crash can be part of a correction or part of a bear market depending on how the decline unfolds afterward.
Selling at the bottom of a bear market is the most common mistake investors make. Markets typically rebound before economic data confirms the worst is over, and investors who sell during the decline usually re-enter at higher prices. A better approach is a rules-based strategy that signals both when to reduce exposure and when to re-enter, helping reduce emotion from the decision.
The worst U.S. bear market in modern history was 1929–1932 during the Great Depression, when the S&P 500 fell 83% from peak to trough. In the post-war era, the 2007–2009 financial crisis bear market was the deepest at 56.8%, followed by the 2000–2002 dot-com bear at 49.1%.
The Model Investing Research Team, led by Chief Investment Strategist Matthew Kerkhoff, is a group of finance professionals, data scientists, and software engineers committed to helping individuals make smarter investment decisions. By combining advanced analytics, behavioral science, and market expertise, they simplify complex financial concepts and deliver clear, actionable insights. Their mission is to empower investors of all levels with the knowledge and tools needed to achieve financial stability and long-term success.
Read More
An innovative approach for eaming higher returns with less risk
Download Report (1.2M PDF)You don’t want to look back and know you could’ve done better.
See PricingPosted in