

Over the last few years a number of automated investment services, known as robo-advisors, have opened their doors. These services are designed to provide ordinary investors with sophisticated portfolio management at a fraction of the cost of a traditional financial advisor.
Their growing popularity has caused a stir in the investment community, but just how good are these robo-advisors?
That’s the question we wanted to answer, and so we did our best to dig up historical performance from the most well-known automated investment services out there: Betterment, Wealth Front and Future Advisor.
Finding Performance Data
After scouring the web for some time, we found that these robo-advisors tend to be rather opaque about their performance. The only firm that published any historical performance data was Future Advisor, and even they did not provide an entirely complete picture, showing only results for a 10-year period from 2005 – 2015.
Adding to the lack of transparency, the disclosure next to their historical performance contains the following language:
The securities in these hypothetical portfolios were selected with the full benefit of hindsight, after their performance over the period shown was known. It is not likely that similar results could be achieved in the future.
We have to give Future Advisor credit, however, as they at least made an effort to open their doors and give investors an idea of what to expect when investing with them. As far as the other robo-advisors who feel compelled to keep their performance data private, we can’t help but wonder what they have to hide.
Benefits of Robo-Advisors
Before we get into Future Advisor’s performance, which is actually representative of the entire cohort of robo-advisors since they all follow a basic strategic asset allocation strategy, let’s examine some of the proposed benefits of robo-advisors.
Here are a few of their highlights:
- Invest primarily in low-cost exchange traded funds
- Charge low management fees (generally between 0.25% – 0.75%)
- Have low minimum account balances
- Enable investors to manage their portfolios without having to speak to a financial advisor
When compared to traditional financial advisors, the lower fees and increased automation of robo-advisors provides a distinct advantage. But how do they stack up in terms of performance, the one metric that matters most? Let’s find out.
Future Advisor Performance
This chart comes directly from Future Advisor’s website. If you had started with $100,000, this is how you would have done following their advice.
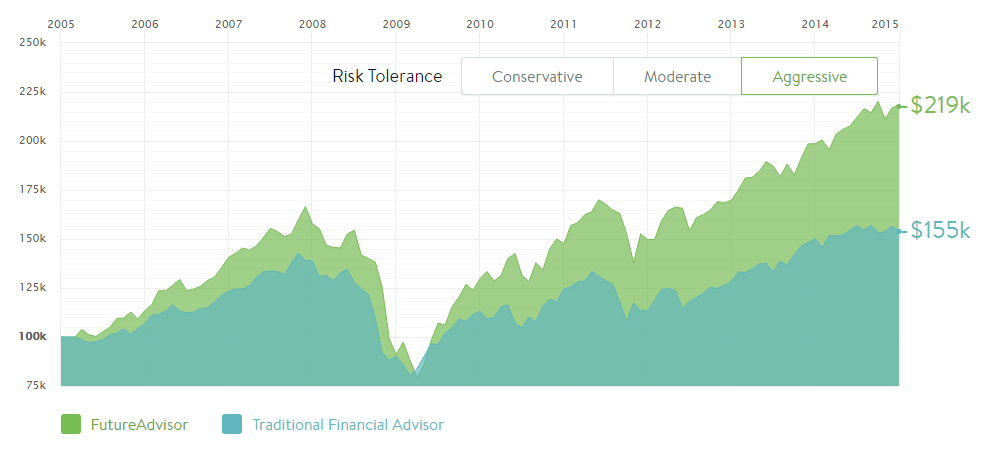
They offer a look at three portfolios based on risk tolerance, which they deem Conservative, Moderate and Aggressive. The resulting performance figures are shown in the table below.
| Future Advisor Performance (1/1/2005 – 1/1/2015) | ||
|---|---|---|
| Risk Tolerance | Ending Balance | Total Return (%) |
| Conservative | $214,000 | 114% |
| Moderate | $217,000 | 117% |
| Aggressive | $219,000 | 119% |
Turning $100,000 into $214,000 – $219,000 over a 10-year period may seem like respectable performance, but is it?
The real value of an investment strategy ultimately boils down to two components: the return achieved, and the amount of risk an investor took to earn that return. Let’s explore how our investment models here at Model Investing stack up against Future Advisor in those two categories.
Model Investing Performance
First, here is a look at how our multi-asset class investment models performed over the same timeframe (1/1/2005 – 1/1/2015). We’ve included the ending value of Future Advisor’s aggressive portfolio on the chart for comparison purposes.
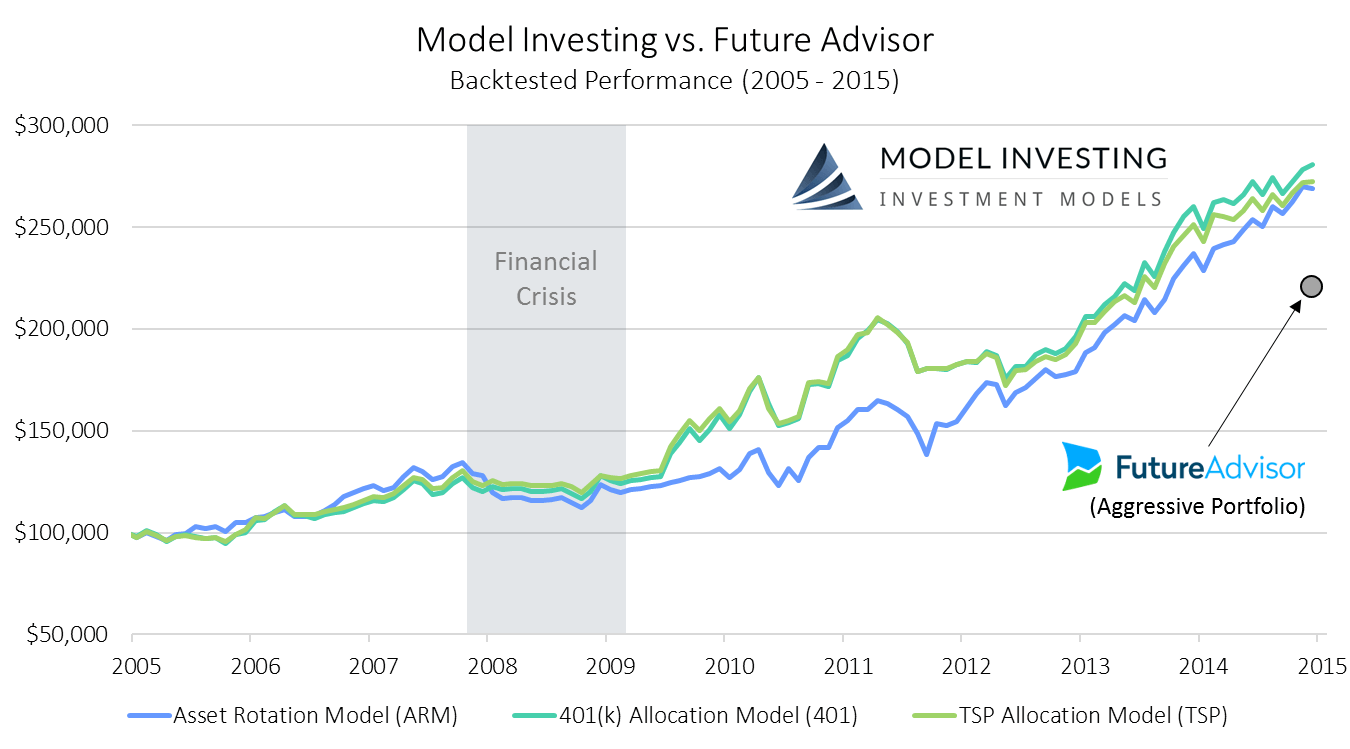
Model performance represents total returns and includes reinvestment of dividends and interest. No management fees or transaction costs are included. Historical performance is not an indication or guarantee of future performance.
Notice that each of our investment models outperformed Future Advisor’s most aggressive portfolio by a significant margin. While that should get you thinking, the real kicker comes in how much risk our investments models took to achieve those higher returns. The short answer? A lot less …
Before we get into the risk side of things, here is a table showing the exact returns of each of our investment models. Future Advisor’s most aggressive portfolio ended up with a 119% return. Our investment models averaged a 174.1% return, beating Future Advisor by an average of 55.1%.
| Investment Model Performance (1/1/2005 – 1/1/2015) | ||
|---|---|---|
| Investment Model | Ending Balance | Total Return (%) |
| Asset Rotation Model (ARM) | $269,189 | 169.2% |
| 401(k) Allocation Model (401) | $280,639 | 180.6% |
| TSP Allocation Model (TSP) | $272,454 | 172.5% |
In dollar terms, that means an investor who began with $100,000 in 2005 would have ended up with an extra $50,189 – $61,639 had they been using Model Investing instead of Future Advisor.
Now, in terms of risk, we don’t have access to Future Advisor’s entire set of performance data, so it’s difficult to draw exact comparisons. But we can still make some very important inferences.
Comparing Risk
In the financial markets there are a variety of ways to measure risk. The most accepted measure of risk is volatility, which measures how consistent an investment strategy is at achieving its returns. Does the portfolio’s value vary widely over time? Or does the portfolio generate consistent returns, year after year, without being subjected to major swings in value?
A simple glance at the charts of Future Advisor’s performance and our investment model performance will provide valuable clues as to the efficacy of the different investment approaches. Notice how Future Advisor’s portfolio exhibits much larger swings in value than our investment models. Specifically, notice the drop in value from late 2007 to early 2009. Future Advisor’s portfolio appears to have lost over half its value during that time.
Now compare that to the behavior of our investment models during the same period. Using an approach called Performance Based Investing, our investment models were able to navigate the market crash in 2008 with minimal losses. This was achieved by dynamically reallocating investments into safer areas of the market during this tumultuous period. Once financial markets stabilized, our investment models moved back into the stock market to capture future growth.
This ability to avoid huge drawdowns in a portfolio’s value is one of the key benefits of our investment models, and it calls into question just how “sophisticated” the automated portfolio management used by Future Advisor and others really is.
If there’s one critically important thing to understand about robo-advisors and the strategy behind their automated portfolios, it’s this: All robo-advisors fundamentally operate on the same investment logic that traditional financial planners have used for decades.
At first you might think that this is a good thing, as it represents the status quo, but I can assure you it’s not. This strategy, known as strategic asset allocation, is a dangerous and outdated way to invest. Click here to learn more about the drawbacks of strategic asset allocation.
Final Thoughts
Not only are our investment models able to outperform Future Advisor’s portfolios by a wide margin from both a risk and return perspective, our investment models also embody the same benefits as robo-advisors listed at the top of the article. Specifically, we use low-cost ETFs, charge very low fees for access to our investment models, don’t have minimum account balances, and enable investors to earn outsized returns without ever having to talk to anyone.
We can add one more benefit to that list: When using our investment models, you remain in complete control of your investments. No trades are executed on your behalf without your knowledge. Our approach is different in that we want to provide our recommendations to you for your review. If you agree with our suggestions, then you can implement them in your own accounts in as little as 5 minutes per month.
If you’re interested in learning more about our service, check out our investment models in more detail. Each of our model description pages contains a complete overview of the strategy, performance, and all relevant risk metrics. We think you’ll be pleasantly surprised by our performance, and by how easy it is to apply our results to your own portfolio.
Whether you invest through your 401(k), the Thrift Savings Plan, or outside the confines of an employer sponsored retirement plan, we have an investment model designed just for you.

The Model Investing Research Team, led by Chief Investment Strategist Matthew Kerkhoff, is a group of finance professionals, data scientists, and software engineers committed to helping individuals make smarter investment decisions. By combining advanced analytics, behavioral science, and market expertise, they simplify complex financial concepts and deliver clear, actionable insights. Their mission is to empower investors of all levels with the knowledge and tools needed to achieve financial stability and long-term success.
Read More
An innovative approach for eaming higher returns with less risk
Download Report (1.2M PDF)You don’t want to look back and know you could’ve done better.
See Pricing