If you’ve spent any time trying to educate yourself about the market, or improve your investment returns, chances are you know who Jim Cramer is. The outspoken host of CNBC’s Mad Money has been creating waves in the investment business for over four decades.
Jim’s illustrious career began at Harvard Law School, where he would publicize his stock picks by leaving them on an answering machine. After attracting private investors and earning them substantial returns, he went on to work as a stock broker with Goldman Sachs.
His success with Goldman led him to create his own hedge fund in 1987, which he ran for 14 years. During his tenure, the fund earned a 24% average annual return and only experienced one losing year. In 1996 Cramer co-founded TheStreet, Inc. (thestreet.com) where he continues to work as a commentator and advisor.
But most people know Cramer from his TV show, Mad Money where he makes stock picks and keeps viewers up to date on the latest market action. On the show, Jim frequently promotes his charitable trust, the Action Alerts PLUS Portfolio.
Actions Alerts Plus is a subscription service offered through TheStreet.com. It allows investors to trade alongside Cramer as he makes investment decisions for his charitable trust stock portfolio. With over 70,000 paid subscribers, the service appears to be very successful. But it begs the question: Just how well has the Action Alerts PLUS Portfolio performed over time?
That’s the question two researchers from the Wharton School at the University of Pennsylvania recently attempted to answer.
In a working paper released last month by Jonathan Hartley and Matthew Olson, the two researches analyzed the performance of the Action Alerts PLUS portfolio from its inception in 2001, all way through 2016. Naturally, when we found out that someone had undertaken this research, we were very curious and wanted to see how Model Investing stacked up.
So what did Hartley and Olson discover?
To put it plainly, they found that Cramer’s Action Alerts PLUS Portfolio underperformed the market. In their words, “Both since inception of the portfolio and since the start of Mad Money in 2005, Cramer’s portfolio has underperformed the S&P 500 total return index and a basket of S&P 500 stocks that does not reinvest dividends.”
They went on to say:
Using factor analysis, we find that Cramer’s portfolio returns are primarily driven by underlevered exposure to market returns and in some specifications tilting toward small cap stocks, growth stocks and stocks with low quality of earnings. These results have broad implications for market efficiency, the usefulness of single name stock recommendations made on television, financial education, and the implementation of academic factors thematic in Cramer’s portfolio.
To put the Action Alerts PLUS Portfolio’s performance in more detail, the Wharton School researchers created the following chart. Here we see Cramer’s portfolio in red, the S&P 500 (without reinvested dividends) in dark blue, and the S&P 500 total return in light blue.
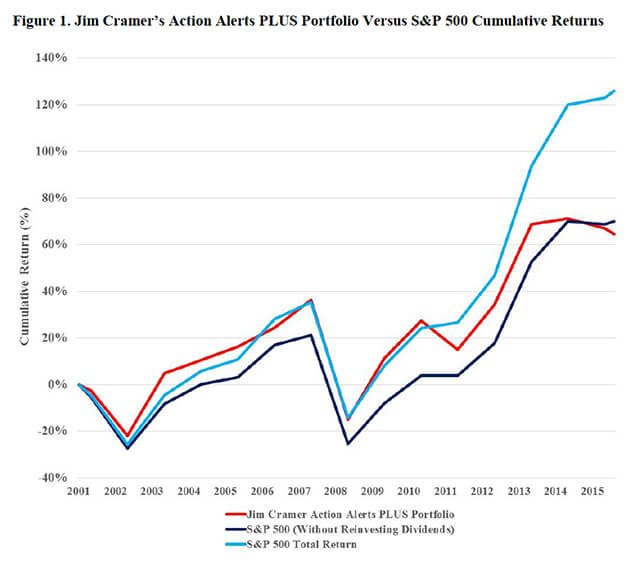
We have great respect for Jim Cramer, but we don’t follow his recommendations … and this is why. The fact that his portfolio has underperformed over time suggests that Action Alerts PLUS subscribers would be better off simply investing in a passive index fund (such as SPY) or finding an investment strategy with a better track record.
Speaking of a better track record, you’re probably wondering how our investment models here at Model Investing stack up against Cramer and his Action Alerts PLUS Portfolio. Let’s take a look at that now.
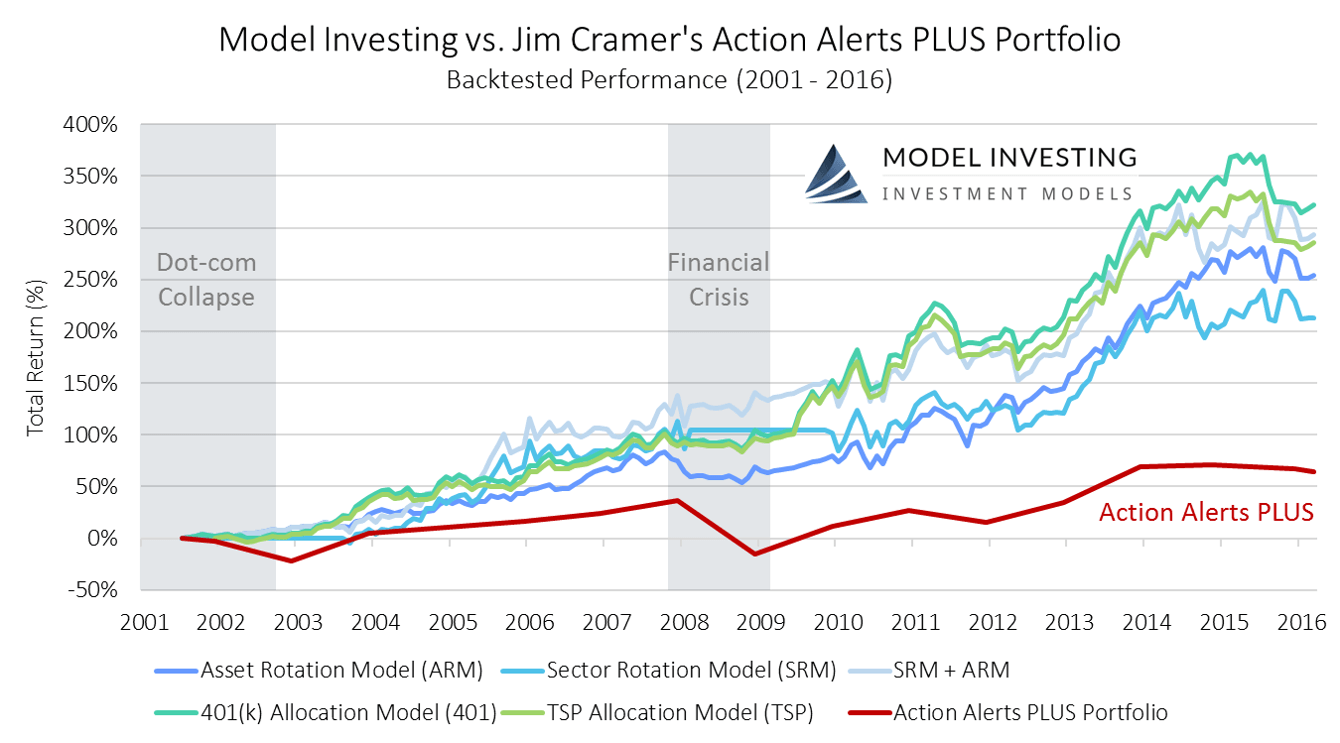
To ensure an apples-to-apples comparison, we’ll look at our own investment model returns over the exact same time period: August 1, 2001 – March 31, 2016. Like the researchers, we’ll also use total return data to show performance including the reinvestment of dividends.
Here’s a chart that shows how our investment models have performed in contrast to the Action Alerts PLUS Portfolio. As you can see there’s quite a significant performance margin.
Model performance represents total returns and includes reinvestment of dividends and interest. No management fees or transaction costs are included. Historical performance is not an indication or guarantee of future performance.
Over the 15 year period analyzed, the Action Alerts PLUS Portfolio generated a 64.5% cumulative return. In contrast, here’s how our Investment Models performed over that same time:
| Investment Model Performance (8/1/2001 – 3/31/2016) | |
|---|---|
| Investment Model | Total Return (%) |
| Asset Rotation Model (ARM) | 254.3% |
| Sector Rotation Model (SRM) | 212.8% |
| SRM + ARM | 293.2% |
| 401(k) Allocation Model (401) | 322.3% |
| TSP Allocation Model (TSP) | 285.5% |
Each one of our investment models more than tripled the returns of Jim Cramer’s Action Alerts PLUS Portfolio.
What you may find even more interesting is that three of our investment models: The Asset Rotation Model, 401(k) Allocation Model, and TSP Allocation Model, are actually complete portfolio management solutions. This means that the returns you would have earned had you been following these investment models would have applied to your entire portfolio.
In contrast, Cramer’s Action Alerts PLUS Porfolio only invests in stocks. So in addition to the (not so spectacular) performance seen above, you may have also experienced a drag from the fixed income portion of your portfolio, leading to an even lower overall return.
By now you’re probably curious how our investment models can beat Cramer and the market by such a large margin. Well … it all comes down to strategy. At Model Investing, we use an innovative strategy that is proven to be far superior to traditional investment management techniques.
You can find out more about it here.
Our investment models are available to the public, cost less than the price of a gym membership to access, and will deliver outstanding performance for you and your family. In as little as 15 minutes per month you can follow our Investment Models in your own accounts, and achieve performance that even Jim Cramer would be envious of.

An innovative approach for eaming higher returns with less risk
Download Report (1.2M PDF)You don’t want to look back and know you could’ve done better.
See Pricing

