
 Log in
See what this would have meant for your balance.
Enter your own TSP balance and a starting date in the Model Calculator to compare the TSP Model against a standard benchmark over the same period.
Recommended Articles

August 3, 2026
FERS Under Pressure: Why Your TSP Matters More in 2026
May 12, 2026
How to Invest Your TSP During a Recession
Ready to raise your investing IQ?
Sign up for our Free Newsletter to access the best investment information money can’t buy.

Published On: August 3, 2026
Last Updated: August 17, 2026
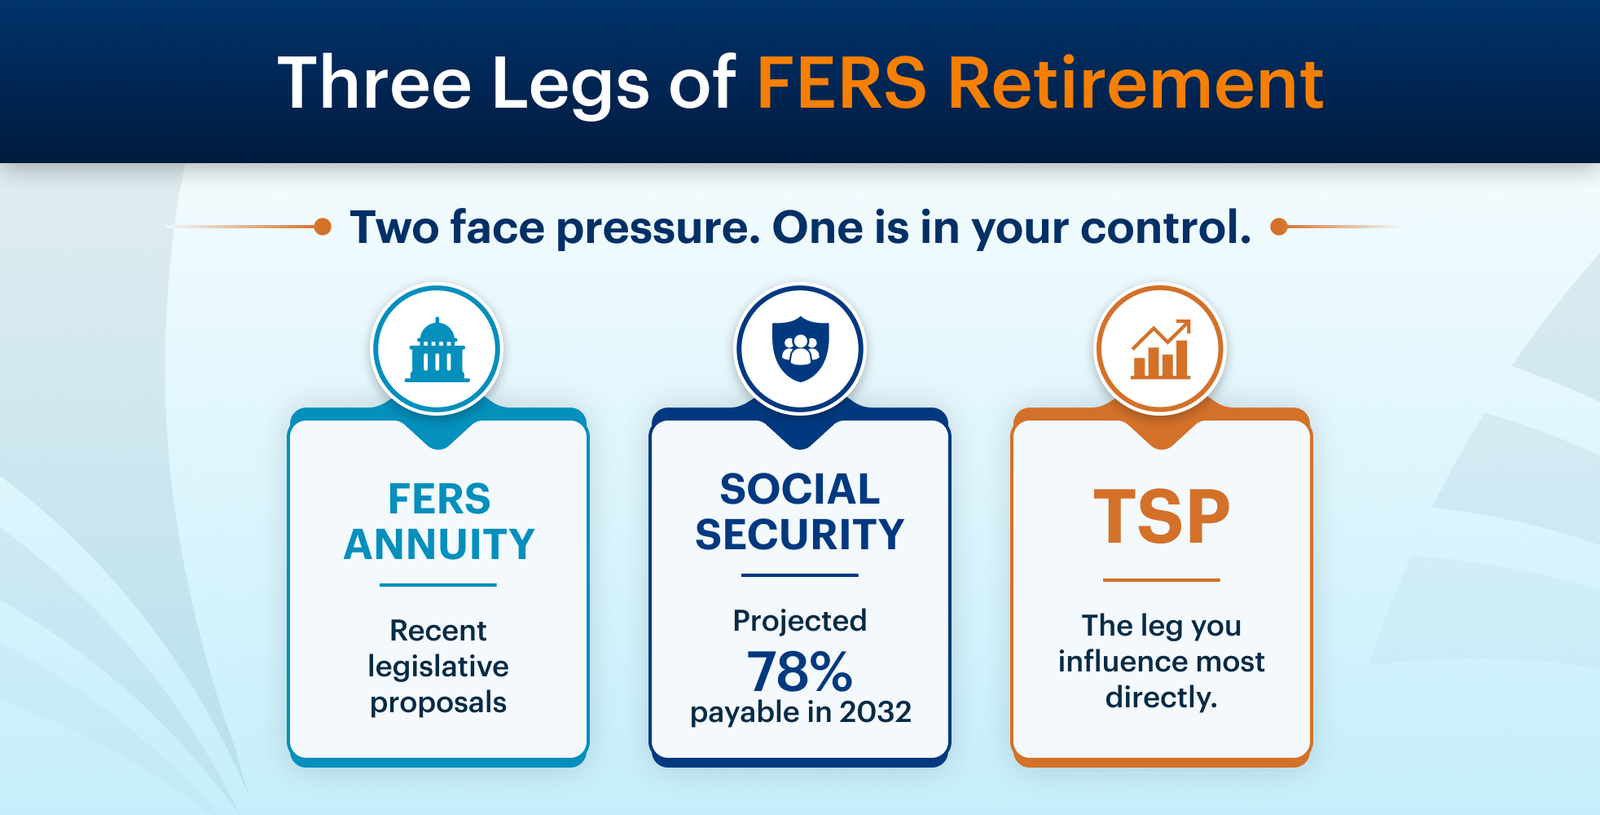
If you’re a civilian federal employee covered by FERS, your retirement was designed to stand on three legs: your FERS basic annuity, Social Security, and your Thrift Savings Plan.
In 2026, two of those legs are facing real pressure. One faces an official government projection of reduced benefits. The other has already been the subject of active legislative proposals. The third is the one over which you have the most direct control.
This article walks through exactly what is happening to each leg, separates what is actually law from what was merely proposed, and explains why the allocation decisions inside your TSP deserve renewed attention.
A note on accuracy: this article distinguishes carefully between enacted law, official projections, and proposals that were introduced but never passed. Where legislation was proposed and later dropped, we say so. Federal retirement is an area where misinformation spreads quickly, and we would rather be precise than dramatic.
FERS was deliberately designed as a three-part system, and that structure comes from federal statute. Unlike the older Civil Service Retirement System, where the pension largely stood on its own, FERS distributes retirement income across three sources:
Together, the three sources are intended to reduce a federal employee’s dependence on any single stream of retirement income.
This is not speculation or advocacy. It is the official projection from the program’s own trustees.
The Social Security Board of Trustees released its 2026 annual report on June 9, 2026. The report projects that the Old-Age and Survivors Insurance (OASI) Trust Fund, which pays retirement and survivor benefits, will have its reserves depleted in the fourth quarter of 2032. At that point, continuing program income would be sufficient to pay approximately 78% of scheduled benefits.
In plain terms, absent congressional action, continuing revenue would cover only about 78% of scheduled retirement and survivor benefits, roughly 22% less than currently scheduled.
Three details matter for federal employees:
On July 14, 2026, a bipartisan group of senators introduced the Protecting Retirement Opportunities and Maintaining Income Security for Everyone (PROMISE) Act. It is worth understanding precisely what this bill does and does not do.
The PROMISE Act does not itself prescribe a tax increase, benefit reduction, or eligibility change. Instead, it would establish a fast-track process for developing and voting on a separate solvency package. If enacted, it would direct the bipartisan Social Security Advisory Board to produce legislation achieving at least 50 years of solvency, then require Congress to consider and vote on it within a defined window. That eventual package could include changes to benefits, taxes, program financing, or some combination of the three.
The PROMISE Act has only been introduced and referred to committee. Whether it passes, and what any eventual reform package contains, is unknown. For planning purposes, the honest position is that this leg carries genuine uncertainty over the next six years.
Here is where a great deal of misinformation circulates, so let us be exact about what happened.
In 2025, an early House Oversight Committee reconciliation proposal included several significant changes to federal retirement benefits. It would have increased FERS contributions for many employees, changed pension calculations from High-3 to High-5, and eliminated the FERS annuity supplement for many future retirees.
The legislation changed as it moved through the House. The House-passed version retained a proposal to eliminate the annuity supplement and a revised contribution provision affecting newly hired employees, but it did not retain the broad High-5 provision or the original contribution increase for existing employees.
The Senate later removed the remaining FERS retirement provisions, and none became law. The annuity supplement remains available under existing eligibility rules, High-3 remains the standard pension calculation, and current employee contribution rates remain in effect.
The significance is not that federal employees have already lost these benefits. They have not. It is that substantial FERS reductions progressed beyond a hypothetical policy paper and entered active budget legislation before ultimately being removed. Similar proposals could return in a future budget cycle.
If you have read elsewhere that your supplement is definitively being eliminated in 2028, that information reflects a proposal that did not become law, not current rules.
You do not set the Social Security payroll tax rate. You do not write the FERS pension formula. But within plan rules, you decide how much you contribute and how your TSP balance is allocated across the G, F, C, S, and I Funds.
That control matters more when the other two legs are uncertain. For many federal employees, the TSP already represents a substantial retirement asset. At the end of January 2026, the average FERS participant account balance was approximately $220,400, according to Federal Retirement Thrift Investment Board data, with long-career employees holding substantially more.
For 2026, the contribution limits give you meaningful room to build that leg:
But contribution limits only determine how much goes in. Allocation determines what happens to it once it is there, and that is where many TSP participants are operating without a process.
The TSP offers five core funds, and they behave very differently from one another. If you want a deeper breakdown of each one, our complete guide to the Thrift Savings Plan covers the structure, tax treatment, and matching rules in detail.
The plan gives you excellent, low-cost building blocks. What it does not give you is tactical guidance on how to combine them in response to changing market conditions. That decision is entirely yours. TSP allocation changes are uncommon in any given month. In January 2026, more than 97% of participants made no interfund transfer at all. Inaction may be intentional, but for many participants it simply reflects a decision made years earlier that has never been reevaluated. Our guide to the best TSP investment funds walks through how the five core funds compare across different risk levels.
The Lifecycle (L) Funds are the TSP’s answer to the allocation question, and for many investors they are a reasonable default. But it is important to understand what they actually respond to.
L Funds follow a predetermined glide path and rebalance toward target allocations based primarily on time to the target date. As that date approaches, they gradually shift from stock funds toward the G and F Funds. What they do not do is make tactical allocation changes in response to prevailing market conditions. An L Fund holds broadly the same allocation whether markets are expanding or contracting, because its glide path is a function of the calendar, not the economy.
That distinction has consequences. A participant in a distant-date L Fund entered the 2008 decline with a heavily equity-weighted allocation and continued following that predetermined glide path throughout the downturn.
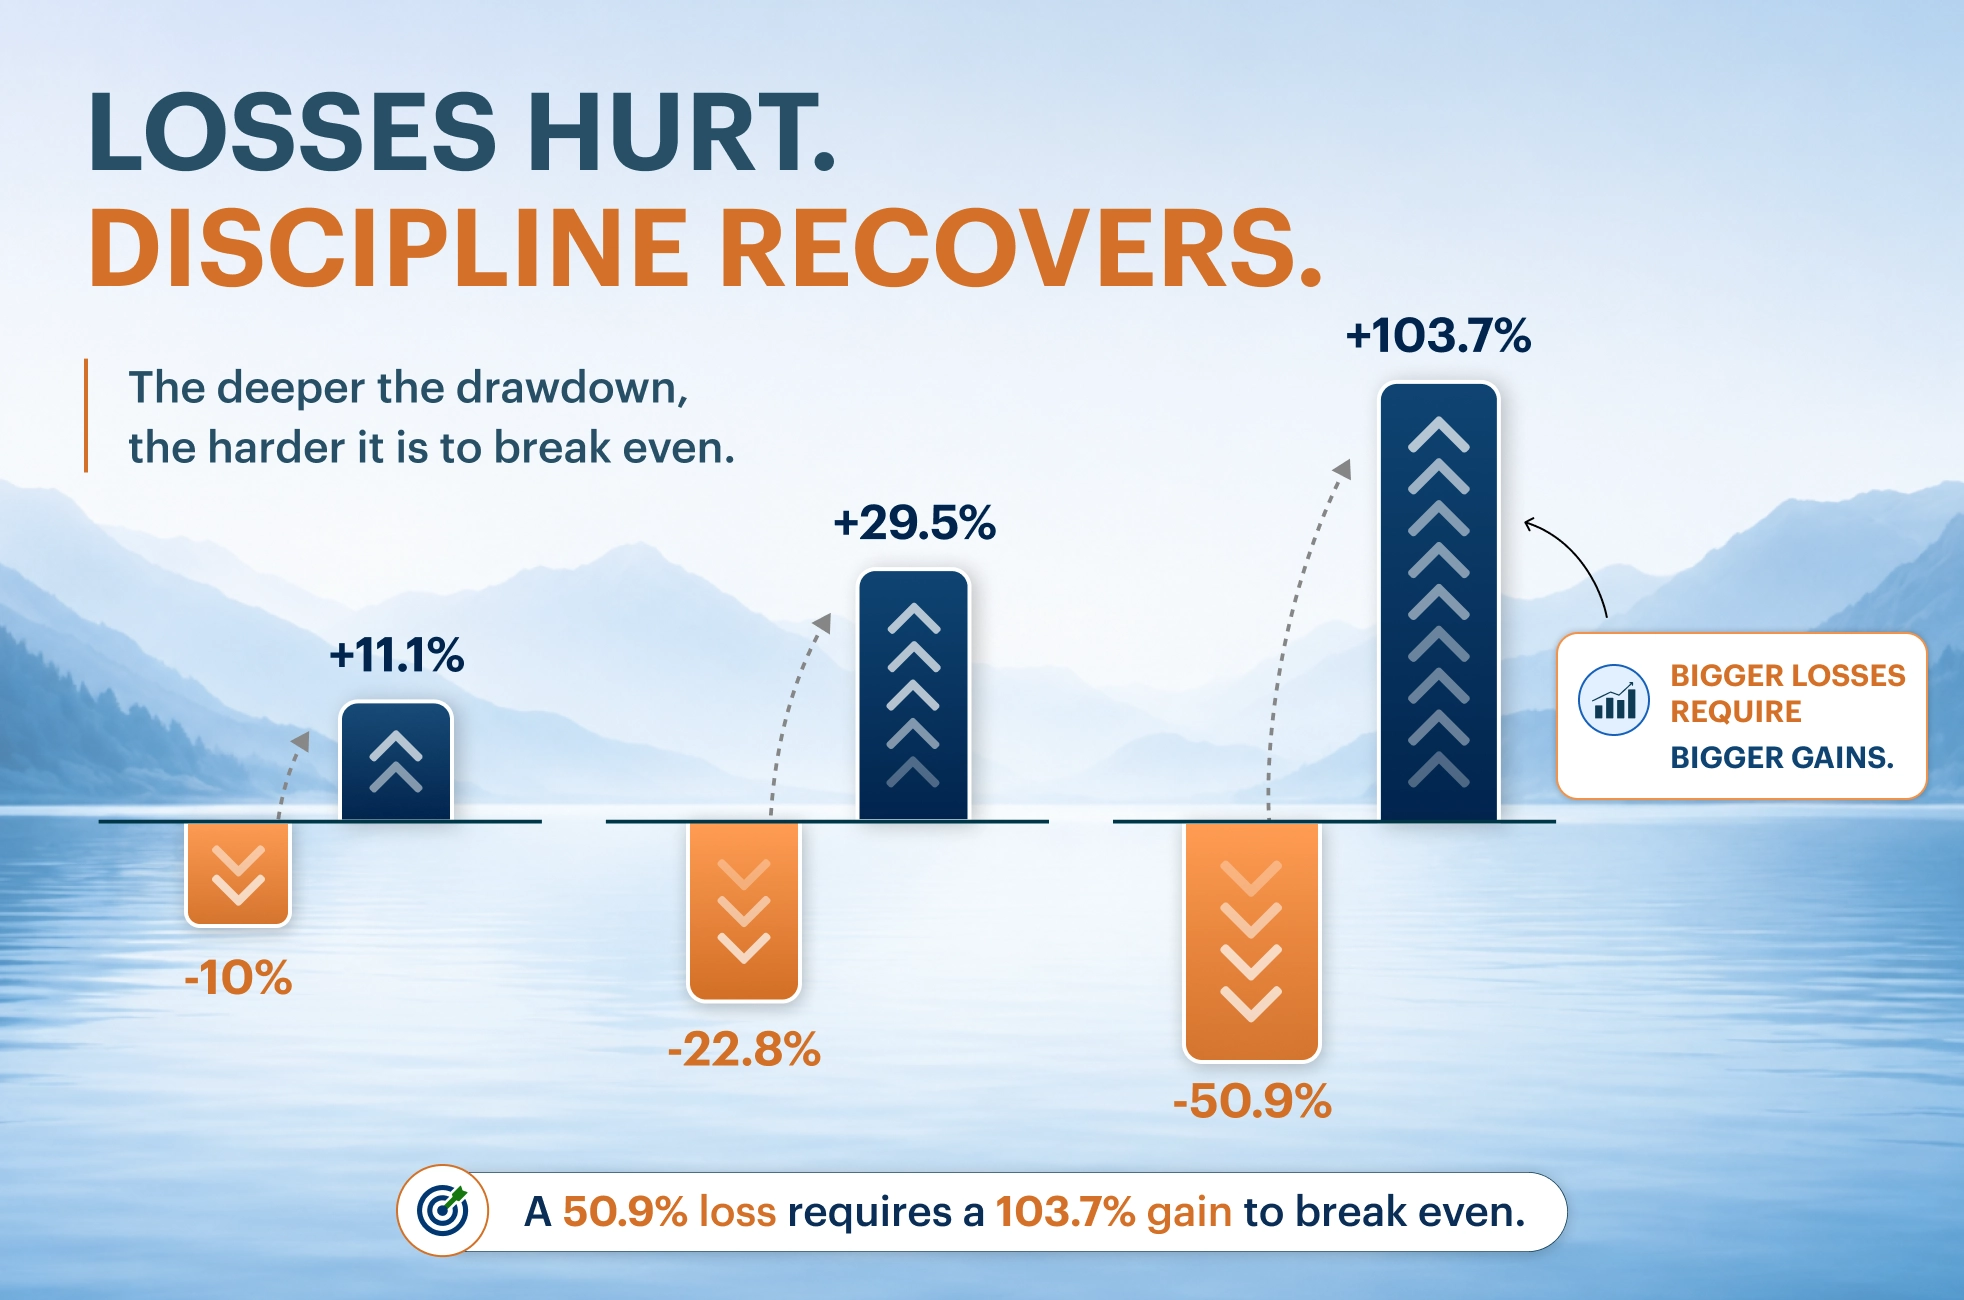
Here is the arithmetic that makes this concrete, and it is the single most useful thing to understand about protecting a retirement account.
Losses and gains are not symmetric. A 50% loss does not require a 50% gain to recover. It requires 100%.
| If You Lose… | You Need This Gain to Break Even | Example |
| -10% | +11.1% | A normal correction |
| -22.8% | +29.5% | TSP Model max drawdown, 2000-2025 |
| -50.9% | +103.7% | C Fund max drawdown, 2000-2025 |
A younger investor generally has more time to recover from a deep drawdown. For a 58-year-old federal employee planning to retire at 62, a 50% drawdown is a fundamentally different event. It may delay retirement or require changes to planned withdrawals, and once withdrawals have begun, sequence-of-returns risk can make recovery considerably more difficult.
This is why, as a general planning guideline, anyone within roughly 15 years of retirement should weigh not only how much a strategy earned, but how much it lost when things went badly, and how long it took to come back.
The TSP Allocation Model was built to provide rules-based allocation guidance within the TSP fund menu. Rather than holding a fixed allocation and hoping, it evaluates market conditions each month and publishes updated allocation guidance across the G, F, C, S, and I Funds, shifting toward defensive positioning when conditions weaken and re-engaging when they improve.
The TSP Allocation Model provides allocation guidance only. It is not age-based and does not account for your retirement date, planned withdrawals, tax situation, or personal risk tolerance.
The table below shows backtested performance over the 26 years from 2000 through 2025, covering the dot-com collapse, the 2008 financial crisis, the 2020 pandemic crash, and the 2022 bear market.
| Strategy | Compound Annual Return | Beta | Std. Deviation | Max Drawdown | Sharpe Ratio |
| TSP Allocation Model | 9.73% | 0.44 | 10.8% | -22.8% | 0.77 |
| C Fund (S&P 500) | 8.08% | 1.00 | 18.0% | -50.9% | 0.43 |
| F Fund (Bonds) | 4.19% | 0.02 | 4.9% | -16.7% | 0.49 |
| 60/40 Stocks/Bonds | 6.91% | 0.54 | 10.2% | -23.7% | 0.54 |
Backtested performance from 2000 to 2025 is hypothetical and reflects the application of the model’s rules to historical data, with dividends and interest reinvested. It excludes management fees and transaction costs. Past performance is not an indication of future results, and all investing involves risk, including the possible loss of principal. See the linked performance page for full methodology.
Two figures deserve particular attention.
The first is the maximum drawdown. The C Fund’s largest peak-to-trough decline over this period was 50.9%. The TSP Model’s largest was 22.8%, less than half. Using the recovery math above, that is the difference between needing a 103.7% gain to get back to even and needing 29.5%.
The second is the beta of 0.44. Beta measures sensitivity to a benchmark’s movements. With the C Fund used as the benchmark, its beta is 1.00 by construction. A beta of 0.44 indicates that the model exhibited substantially less sensitivity to C Fund movements over the period. The backtest also produced lower volatility and a higher compound annual return, although those historical relationships are not guaranteed to persist. You can review the full TSP Model performance analysis, including additional risk-adjusted return measures, for the complete picture.
If you want to understand the reasoning behind this approach rather than just the results, the academic research behind the models covers the market anomalies and economic indicators the models are built on.
Enter your own TSP balance and a starting date in the Model Calculator to compare the TSP Model against a standard benchmark over the same period.
Verify your own numbers through OPM and TSP.gov. Your minimum retirement age, your service computation date, and your supplement eligibility are specific to you. As covered above, several widely repeated changes were never enacted.
FERS employees receive a 1% automatic agency contribution regardless of how much they contribute. Contributing at least 5% of basic pay earns the full additional 4% agency match. Contributing less than 5% leaves part of that match unclaimed. If you are front-loading toward the $24,500 limit, make sure you are not maxing out before December and cutting off matching contributions in the final pay periods.
If you cannot recall the last time you reviewed your TSP allocation, or if it reflects a choice you made when you first enrolled, that is not a strategy. It is an accident that has been compounding. Even deciding to keep it is better than never having examined it. If you are not sure where to start, our guide to which investment model is right for you matches each account type to the appropriate strategy.
If your retirement date is inside of 15 years, evaluate any strategy on what it does in bad years. A strategy that earns slightly more but loses twice as much in a crash may not be the better strategy for someone with a fixed retirement horizon. The retirement calculator can help you see how different assumptions affect your projected retirement income.
Two of the three legs of the FERS retirement system are subject to decisions made in Washington. The Social Security leg faces an official projection that only about 78% of scheduled benefits would be payable in 2032 unless Congress acts. The FERS annuity leg has already been the subject of active reduction proposals, and could be again.
Your TSP is the leg you can influence most directly. You control your contribution and allocation decisions, although market losses and recovery periods remain uncertain. A deliberate allocation process can help you manage those risks more consistently, starting with treating your allocation as something you manage rather than something you set once and forget. You can start your free month and see the current TSP Model recommendation before deciding whether the approach fits your situation.
Get monthly TSP allocation guidance across the G, F, C, S, and I Funds. About five minutes a month. Free for your first month, cancel anytime.

No. Proposals to eliminate the FERS annuity supplement advanced through the House in 2025, and the House-passed bill retained a version of that provision. However, the Senate removed the remaining FERS retirement provisions, and none became law. The supplement remains available under existing eligibility rules. Similar proposals could be introduced again in a future budget cycle, so it is worth monitoring, but nothing has been enacted.
The 2026 Social Security Trustees Report projects that the OASI Trust Fund reserves will be depleted in the fourth quarter of 2032, at which point continuing revenue would be sufficient to pay approximately 78% of scheduled benefits, roughly 22% less than currently scheduled. This is a projection under current law, not a certainty. Congress can change the outcome by acting before then, and the bipartisan PROMISE Act introduced in July 2026 would establish a process intended to require congressional consideration.
The elective deferral limit for 2026 is $24,500. Participants age 50 and over can contribute an additional $8,000 in catch-up contributions, for a total of $32,500. Under SECURE 2.0, participants turning 60, 61, 62, or 63 during 2026 have a higher catch-up limit of $11,250, for a total of $35,750. If your prior-year wages from your federal employer exceeded $150,000, catch-up contributions must be made to the Roth TSP.
L Funds are a reasonable low-effort default and generally preferable to having no deliberate allocation process. They follow a predetermined glide path and rebalance toward target allocations based on time to the target date. What they do not do is make tactical changes in response to market conditions, because the glide path follows the calendar, not the economy. Investors who want their allocation to respond to changing conditions need a different approach.
The TSP Allocation Model is a rules-based strategy from Model Investing designed specifically for Thrift Savings Plan accounts. Each month, Model Investing reviews prevailing conditions and publishes the current recommended allocation across the TSP funds. The allocation does not necessarily change every month. When an update is called for, you apply it within your existing TSP account, which typically takes about five minutes. The step-by-step TSP Model tutorial shows exactly how to implement each update.
No. Your account stays exactly where it is, at TSP.gov. Model Investing publishes the monthly recommended allocation, and you decide whether and how to apply it within your own account.
The Model Investing Research Team, led by Chief Investment Strategist Matthew Kerkhoff, is a group of finance professionals, data scientists, and software engineers committed to helping individuals make smarter investment decisions. By combining advanced analytics, behavioral science, and market expertise, they simplify complex financial concepts and deliver clear, actionable insights. Their mission is to empower investors of all levels with the knowledge and tools needed to achieve financial stability and long-term success.
Read More
An innovative approach for eaming higher returns with less risk
Download Report (1.2M PDF)You don’t want to look back and know you could’ve done better.
See PricingPosted in