


For most investors, the idea of “getting out at the top” is as illusive an idea as winning the lotto, or licking your elbow. The chances of picking that one magical day just seem too low to be probable. But is it really that tough? Or do most investors simply have a poor understanding of how stock market tops develop?
We’d venture to say the latter.
When market historians go back and look at previous bull and bear markets, they often point to one particular day on which the market topped out. For the most recent financial crisis, that day was October 9, 2007. This was the day that the S&P 500 Index, representing the stocks of the 500 largest U.S. companies, reached its peak.
But was that really the best day to sell stocks? It depends on how you look at it.
Different Stocks/Indexes Peak at Different Times
If you happened to be invested primarily in an index fund that tracked the S&P 500, then yes, that would have been the best day to sell. But what if you owned primarily small-cap stocks? Or perhaps an index fund that tracked the tech-heavy Nasdaq?
In either of those cases, October 9th was not the ideal time to sell because each of those groups hit their respective peaks at different times than the S&P 500. Specifically, the Russell 2000 (a proxy for small-cap stocks) reached its peak on July 13th – three months prior, while the Nasdaq hit its final high-water mark on October 31st – 22 days after the S&P 500.
Other groups of stocks differed even more. The Dow Jones Utility Average topped out on May 21st – nearly five months before the S&P 500, while the Dow Jones U.S. Bank Index reached its bull-market high on February 20th – almost eight months prior to the “official” end of the bull market.
So what does all this mean?
This data suggests that while October 9th, 2007 will go down in history as the “end of the bull market,” the vast majority of stocks and indexes did not peak on that day. Instead, they peaked sometime during the roughly ten-month window from February, 2007 – November, 2007.
This means that even if you had sold all your stocks precisely on October 9th, chances are that wouldn’t have been the day that your portfolio was at its peak.
Stock Market Tops are Rounded, Not Sharp
What this hints at is the notion that the stock-market topping process is not a sharp trend reversal, but rather a gradual rolling-over. This is a very important concept to understand, because it implies that getting out near the top of a bull market is not only possible, but quite feasible if you know where to look.
To highlight this, we’re going to focus once again on the price action of the S&P 500. Notice in the chart below that while the S&P 500 reached its official peak on October 9th (the vertical green line), the topping process took many months to play out.
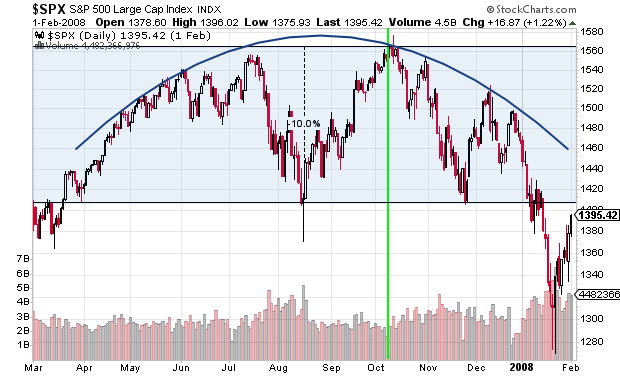
During this period, investors had nearly a year-long window in which they could have reduced exposure to stocks while the S&P traded within 10% of its 2007 peak (blue shaded area). From this perspective, getting out at the top did not require impeccable timing, but rather a simple acknowledgement that the upward momentum in stocks had slowed, while economic fundamentals were beginning to deteriorate.
What about the 2000 market peak? Did that behave the same way?
You bet it did. In the chart below we can again see the S&P 500 as it traces out a slow, rolling top from late 1999 until the end of 2000. Here, too, investors had roughly a year in which they could have sold stocks within 10% of the market’s ultimate peak, which occurred on March 24th (green vertical line).

We could keep going back through time, looking at various market peaks, but I think the point here is clear. Stock market tops do not occur on one particular day, and they are not sharp trend reversals. Instead, stock market tops tend to develop over a number of months, providing ample time to reposition a portfolio as long as the investor is paying attention.
Stock Markets Anticipate Economic Conditions
At this point, you may be wondering: What causes the stock market to top out anyway? Is it just a natural phenomenon that occurs when there are more sellers than buyers? Or is there something larger at work?
That’s a great question, and the answer is actually quite simple. The stock market looks ahead roughly 6-12 months and it attempts to “discount” future economic conditions. That is, major market participants are constantly trying to position themselves to benefit from economic and corporate developments (such as an increase in profits) that are expected to occur in the coming months.
When these investors look ahead and begin to see that economic conditions are likely to deteriorate, they start to sell stocks. Why? Because if the economy is headed for a downturn, then corporations are likely to see declines in their overall profits. Since a share of stock is really just a share in the future profits of a company, that share price loses value as the outlook for corporate profits deteriorates.
Thus, we can summarize this all by saying that the stock market will top out, when a recession is on our doorstep.
If you want some additional validation for this, consider the following:
- After the stock market “peaked” on October 9th, 2007, the great recession officially began in December, 2007.
- After the stock market “peaked” on March 24th, 2000, the subsequent recession began in March, 2001.
We see this pattern of the stock market topping out in response to an approaching recession going all the way back through history. Thus, the key to understanding the stock market is really to understand the ebb and flow of our economy.
Whatever Happens … Don’t Panic
There are many Wall Street adages that have arisen over time. Some of these hold great wisdom, while others are relics of an older time. One that carries its own weight, and is a favorite among Wall Street veterans, is this: Be quick to turn bullish, slow to turn bearish.
If you think about it, the latter half of that maxim is directly related to what we just discussed. When the stock market has a positive, bullish trend, you don’t need to have your hand over the sell button, ready to dump all of your stocks at the first sign of trouble.
Instead, you should now recognize that the stock market takes its time as it rolls over, and this is accompanied by a variety of other warning signs (often called leading indicators) that suggest our economy is headed south. When these signs begin to present themselves, it’s time to take some chips off the table.
But this doesn’t have to be done in a brash manner, and indeed most of the time it shouldn’t. Because the stock market takes months to roll over, we have plenty of opportunity to assess the situation and make our moves accordingly. This means that under no circumstances should you panic. Not only is there no need for it, making emotional investment decisions is usually the worst thing you can do in any given situation.
Now that you have an improved understanding of how stock market tops unfold, and why, you should be able to make better informed investment decisions moving forward. But as always, if you’d like a little bit of guidance, our Investment Models are just a click away.

The Model Investing Research Team, led by Chief Investment Strategist Matthew Kerkhoff, is a group of finance professionals, data scientists, and software engineers committed to helping individuals make smarter investment decisions. By combining advanced analytics, behavioral science, and market expertise, they simplify complex financial concepts and deliver clear, actionable insights. Their mission is to empower investors of all levels with the knowledge and tools needed to achieve financial stability and long-term success.
Read More
An innovative approach for eaming higher returns with less risk
Download Report (1.2M PDF)You don’t want to look back and know you could’ve done better.
See Pricing