
Becoming a successful investor requires more than just stock-picking skills—it requires understanding the business cycle. This periodic ebb and flow of economic activity profoundly impacts asset prices, interest rates, employment opportunities, and overall financial stability.
Recognizing where we are in the cycle can help you optimize your investment strategy and make better financial decisions, such as:
- Determining the best time to invest in stocks or bonds
- Deciding when to buy a home or refinance a mortgage
- Planning career moves, such as changing jobs or starting a business
Since nearly every aspect of your financial life is affected by the business cycle, understanding its phases can provide a critical advantage in achieving long-term financial success. In this article, we’ll explore the four phases of the business cycle, how to align your investment strategy with each phase, and how Model Investing can help you stay in sync with the cycle for optimal returns.
What is the Business Cycle?
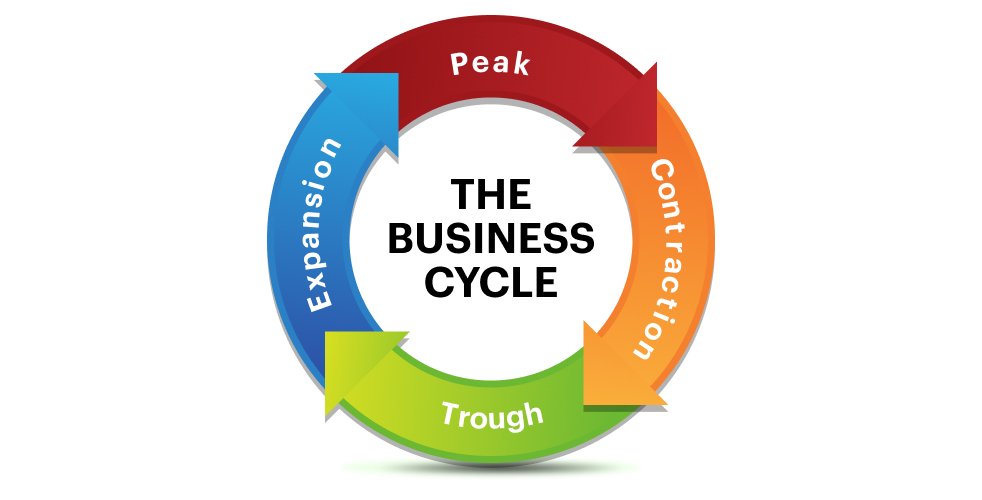
The business cycle refers to the recurring pattern of economic expansion and contraction in free-market economies. It is sometimes called the economic cycle or the boom-and-bust cycle.
Measuring Economic Growth: The Role of GDP
Economic growth is measured by Gross Domestic Product (GDP)—the total value of goods and services produced in a country over a specific period. The two main types of GDP are:
- Nominal GDP: Measured using current prices, which means it includes the effects of inflation.
- Real GDP: Adjusted for inflation, making it a more accurate measure of whether the economy is genuinely growing or shrinking.
During an expansion, real GDP increases as businesses produce more goods and services. During a recession, real GDP declines, signaling a contraction in economic activity.
The Four Phases of the Business Cycle
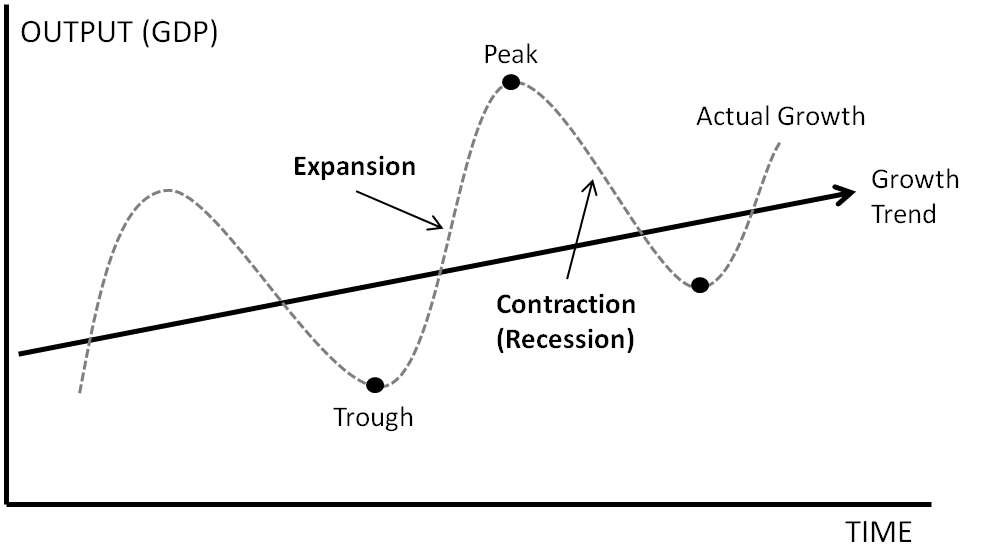
As populations grow and productivity improves through advancements like technology, economies naturally tend to expand over time. However, this growth is not always consistent. Instead, economies experience periods of rapid growth followed by times of slower growth or even contraction, where the economy shrinks.
This pattern is illustrated in the chart below, where the vertical axis represents the size of the economy, and the horizontal axis represents time. The “Growth Trend” line shows the long-term average growth of the economy, rising upward to indicate that, over the long term, most economies expand.
The economic cycle can be broken down into four distinct phases:
1. Expansion (Growth Phase)
During this phase, the economy experiences:
- Increasing consumer and business spending
- Rising stock prices and corporate earnings
- Job creation and higher wages
- Gradual increases in interest rates
2. Peak (Turning Point)
The peak marks the end of an expansion and the beginning of a slowdown. At this stage:
- Economic activity is at its highest
- Unemployment is low, but wage growth slows
- Inflation may rise due to strong demand
- Investors may notice stock prices becoming overvalued
3. Contraction (Recession Phase)
A contraction occurs when economic growth slows and turns negative:
- Declining business activity and lower consumer spending
- Rising unemployment as companies cut costs
- Stock prices decline while bonds gain appeal
- Interest rates may be lowered to stimulate growth
4. Trough (Recovery Phase)
The trough represents the lowest point of the cycle before the next expansion begins:
- Economic activity stabilizes
- Businesses start hiring again
- Stocks begin recovering as investors anticipate growth
- Lower interest rates help spur borrowing and investment
These alternating expansion and contraction periods have occurred repeatedly throughout U.S. history—with 33 complete business cycles recorded since 1854.
Understanding Recessions: How Are They Defined?
A recession is commonly defined as two consecutive quarters of declining real GDP. However, the official determination of a recession in the U.S. is made by the National Bureau of Economic Research (NBER).
The NBER identifies peaks and troughs in economic activity, marking the official beginning and end of recessions. Instead of relying solely on GDP, it considers multiple indicators, including employment, industrial production, and consumer spending.
By analyzing these factors, the NBER provides a more comprehensive assessment of economic downturns, ensuring that recessions are identified based on broad economic conditions rather than a single measure.
How Long Do Expansions and Recessions Last?
Historically, economic cycles vary in length, but trends show:
- Expansions last longer – Average of 58 months since 1945
- Recessions are shorter – Average of 11 months since 1945
This means that while downturns do occur, the long-term trend is always upward, reinforcing the importance of staying invested strategically during all market conditions.
Key Financial Indicators During Each Phase
Understanding how major financial variables move through the business cycle can help you anticipate market trends:
During an Expansion:
- Stock prices rise as companies report higher profits
- Interest rates gradually increase, making borrowing more expensive
- Wages rise as job markets tighten
- Bond prices fall as investors prefer stocks
- Real estate values rise as demand strengthens
During a Recession:
- Stock prices fall as companies struggle with lower profits
- Interest rates decrease, making borrowing cheaper
- Unemployment rises, reducing wage growth
- Bond prices rise as investors seek safe assets
- Real estate values stagnate or decline due to weaker demand
From a personal finance perspective, the best time for major financial decisions (buying a home, starting a business, or changing jobs) is early to mid-expansion—when conditions are most favorable.
How to Invest in Sync with the Business Cycle
A key takeaway from understanding the business cycle is knowing when to adjust your investment strategy.
- During an expansion: Invest primarily in stocks to capitalize on corporate growth.
- During a contraction: Shift your portfolio toward bonds as a defensive measure.
Since market timing is difficult, most investors struggle with recognizing cycle shifts in real-time. This is where Model Investing provides an edge.
The Advantage of Model Investing
At Model Investing, our data-driven investment models are designed to:
- Analyze economic indicators in real-time to detect cycle shifts early
- Adjust allocations dynamically between stocks and bonds based on market conditions
- Provide clear, actionable guidance to help investors maximize returns while minimizing risk
By following a structured, evidence-based approach, Model Investing allows you to invest in sync with the business cycle—avoiding costly emotional decisions and staying ahead of market trends.
Invest smarter. Optimize your portfolio with Model Investing.
Conclusion: Stay Ahead of the Market with Model Investing
The business cycle plays a crucial role in shaping investment returns, economic policy, and personal financial decisions. While predicting exact cycle movements is impossible, understanding how expansions and contractions affect markets allows you to position your investments for long-term success.
For those looking to remove the guesswork from investing, Model Investing’s systematic approach offers a proven way to stay aligned with economic cycles and enhance portfolio performance.
Want to invest smarter? Explore our investment models today and start investing in sync with the business cycle.
FAQs:
1. What is the business cycle, and why is it important for investors?
The business cycle refers to the recurring pattern of economic expansion and contraction that affects asset prices, interest rates, employment, and overall financial conditions. Understanding the cycle helps investors optimize their investment strategies, determine the best time to buy or sell assets, and make informed financial decisions.
2. How does the business cycle impact stock and bond investments?
During expansion, stock prices tend to rise as companies grow and generate higher profits, while bonds become less attractive due to rising interest rates. During contractions (recessions), stock prices typically decline, making bonds a safer investment choice as interest rates fall. Aligning your portfolio with the business cycle can help maximize returns and reduce drawdowns.
3. How do interest rates change throughout the business cycle?
Interest rates gradually increase during an expansion as economic growth strengthens and demand for borrowing rises. At the peak, rates may be at their highest. During a recession, interest rates typically decrease as central banks lower them to stimulate economic activity. Understanding this trend helps investors and borrowers make better financial decisions.
4. When is the best time to buy a home or refinance a mortgage?
The best time to buy a home or refinance is typically early to mid-expansion when the economy is growing but interest rates are still relatively low. During a recession, interest rates may drop, creating good refinancing opportunities, but home prices may also stagnate or decline due to weaker demand.
5. How do leading indicators predict changes in the business cycle?
Leading indicators are economic metrics that signal future economic shifts before they happen. Examples include jobless claims, consumer confidence, manufacturing activity, and new building permits. When jobless claims rise and new building permits decline, they often signal an economic slowdown. Conversely, falling jobless claims and rising new building permits suggest economic expansion. Investors and policymakers use these signals to anticipate market changes and adjust strategies accordingly.
6. What is the relationship between consumer confidence and the business cycle?
Consumer confidence measures how optimistic people are about the economy and their financial future. It tends to be high during expansions when employment is strong and spending increases. During recessions, confidence drops, leading to lower consumer spending, which can further slow economic growth. Monitoring consumer confidence can provide early warnings about economic turning points.
7. How do government policies influence the business cycle?
Governments use monetary and fiscal policies to influence economic cycles. Central banks adjust interest rates and implement quantitative easing or tightening to either stimulate or slow down the economy. Governments can also use tax cuts, stimulus spending, or regulatory changes to influence business activity. These actions help mitigate downturns and prevent overheating during rapid growth phases.

The Model Investing Research Team, led by Chief Investment Strategist Matthew Kerkhoff, is a group of finance professionals, data scientists, and software engineers committed to helping individuals make smarter investment decisions. By combining advanced analytics, behavioral science, and market expertise, they simplify complex financial concepts and deliver clear, actionable insights. Their mission is to empower investors of all levels with the knowledge and tools needed to achieve financial stability and long-term success.
Read More
An innovative approach for eaming higher returns with less risk
Download Report (1.2M PDF)You don’t want to look back and know you could’ve done better.
See Pricing