
Get Clear Guidance for Your TSP Allocation
See how the TSP Model helps you evaluate your current TSP allocation, manage risk more confidently, and make smarter decisions for today’s market.
Ready to raise your investing IQ?
Sign up for our Free Newsletter to access the best investment information money can’t buy.

Published On: May 12, 2026
Last Updated: June 8, 2026
Recessions are an unavoidable part of the economic cycle. They have occurred roughly every seven to ten years throughout modern history, and while the timing is never certain, the pattern is remarkably consistent. For federal employees and military members with Thrift Savings Plan accounts, the question is never if a recession will come it’s whether you’ll be prepared when it does.
As of early 2026, the U.S. economy remains in expansion territory. Corporate profits are growing, unemployment sits near historical lows, and the Federal Reserve has moved cautiously with rate policy after cutting rates in late 2025. But beneath the surface, there are signs of strain: consumer confidence among lower-income households has weakened, trade tensions continue to create uncertainty for businesses, and several reliable recession indicators have flashed warning signals over the past two years.
The point isn’t to predict exactly when the next downturn will arrive. The point is to understand how recessions affect your TSP—and to have a clear strategy for protecting and growing your retirement savings no matter what the economy throws at you.
This guide will walk you through how each TSP fund behaves during recessions, the critical mistakes that cost federal employees thousands of dollars during past downturns, and a practical framework for positioning your TSP allocations to weather any storm.
Most TSP investors understand, at least in theory, that stocks go through periods of decline. But there is a significant gap between understanding this intellectually and experiencing it with your own retirement savings on the line.
During the 2008 financial crisis, the C Fund—which tracks the S&P 500 lost approximately 37% of its value in a single year. The S Fund, which tracks smaller U.S. companies, fell even harder, losing roughly 38%. Investors who had the majority of their TSP in these stock funds saw decades of contributions evaporate in a matter of months.
The COVID crash in early 2020, while shorter in duration, saw the C Fund drop more than 30% from peak to trough in just five weeks. Federal employees who panicked and moved everything to the G Fund locked in those losses—and then missed the sharp recovery that followed.
This is the cruel paradox of recession investing: the emotional response that feels safest (selling stocks and moving to cash) is almost always the most destructive decision you can make. The investors who recover fastest from recessions are not the ones who avoid all losses. They are the ones who have a plan in place before the downturn begins.
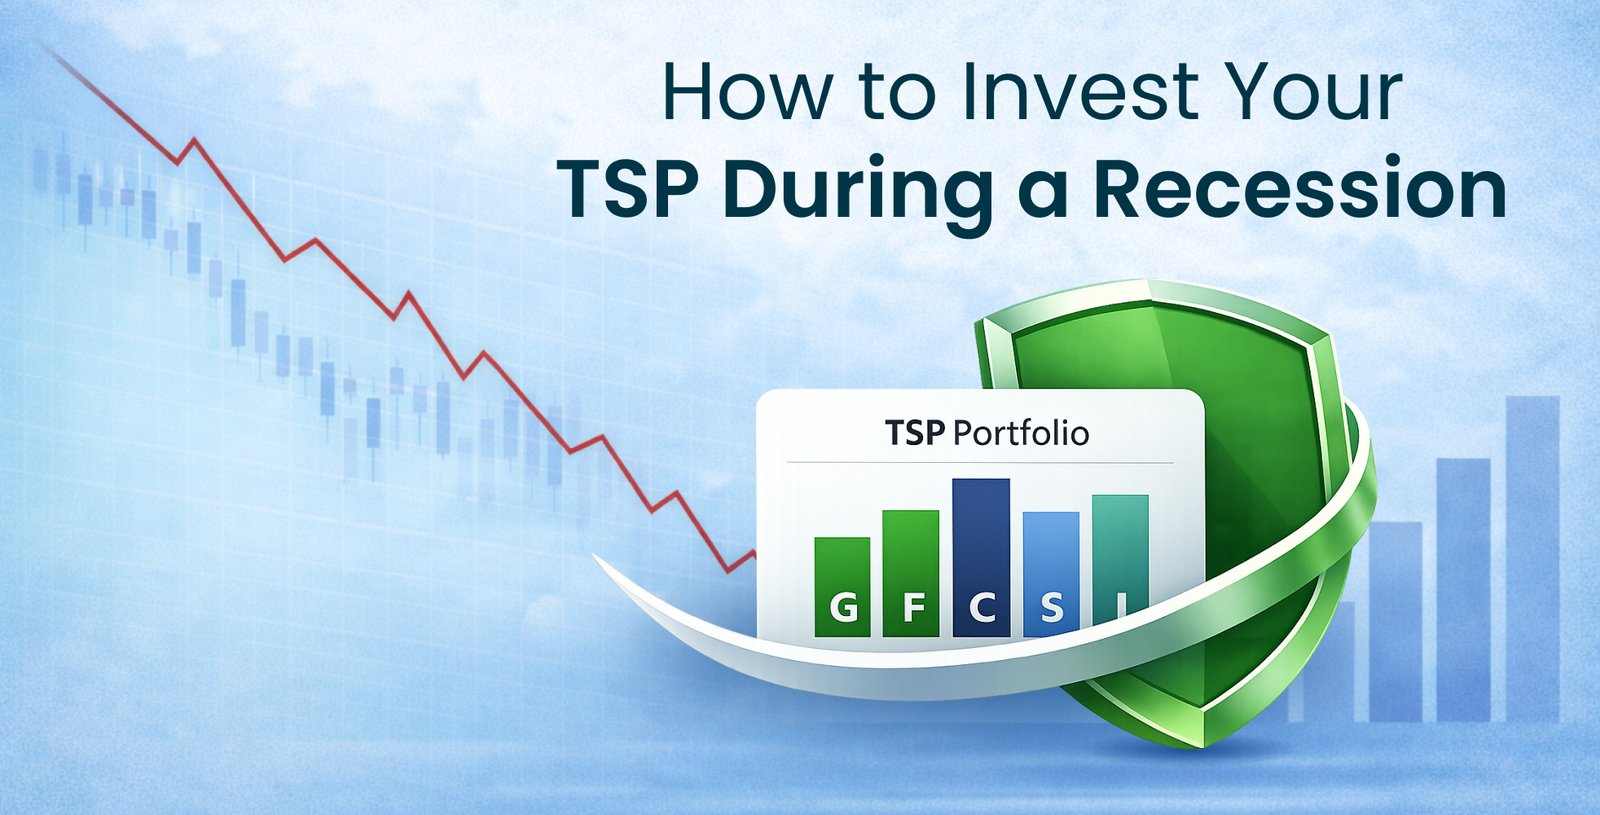
Your Thrift Savings Plan gives you access to five core TSP funds, and each one responds to economic downturns differently. Understanding these differences is the foundation of any sound recession strategy.
The G Fund is the only TSP fund that guarantees your principal will never lose value. It invests in special-issue U.S. Treasury securities that are backed by the full faith and credit of the federal government. During every recession in TSP history, the G Fund has continued to deliver positive returns while stock funds were falling.
The trade-off is lower long-term growth. The G Fund’s returns typically hover around the rate of inflation, which means it preserves purchasing power but won’t build significant wealth on its own. Think of the G Fund as your portfolio’s anchor—it won’t make you rich, but it will keep you from going backward when markets are in freefall.
The F Fund tracks the Bloomberg U.S. Aggregate Bond Index, which includes government and corporate bonds. During typical recessions, bonds tend to perform well because the Federal Reserve cuts interest rates to stimulate the economy, and falling rates push bond prices higher.
This played out during the 2008 crisis, when the F Fund gained over 5% while stock funds were down 30–40%. However, the F Fund is not risk-free. In 2022, when the Fed raised rates aggressively to fight inflation, the F Fund lost over 12%—a reminder that rising rate environments can hurt bonds even during periods of economic stress.
The lesson: the F Fund is generally a strong defensive holding during recessions, but its performance depends heavily on the direction of interest rates.
The C Fund is the heart of most TSP portfolios, and for good reason—it tracks the 500 largest U.S. companies and has delivered the strongest long-term returns of any TSP fund. But that growth comes with significant downside risk during recessions.
The C Fund lost about 37% in 2008 and took roughly four years to fully recover (including dividends). Over the 26-year period from 2000 to 2025, the C Fund’s maximum drawdown—the worst peak-to-trough decline—reached approximately 51%. That means an investor with $500,000 in the C Fund would have seen their balance drop to roughly $245,000 at the worst point.
For TSP investors with a long time horizon and the discipline to stay invested, the C Fund’s recoveries have always eventually surpassed previous highs. The challenge is having the stomach and the strategy to weather the storm.
The S Fund tracks small- and mid-sized U.S. companies that aren’t included in the S&P 500. These stocks typically fall harder and faster during recessions because smaller companies have less financial cushion and more limited access to credit.
During the 2008 crisis, the S Fund declined roughly 38%. In the COVID crash, it dropped even more sharply in the initial selloff than the C Fund. The flip side is that small caps often lead the recovery—when the Fed flooded markets with liquidity in 2020, the S Fund surged back aggressively.
The S Fund is a powerful growth tool in your TSP, but it’s also the most volatile. During recessions, it tends to amplify whatever the C Fund is doing—both on the way down and on the way back up.
The I Fund provides exposure to international stocks across developed and emerging markets (excluding the U.S., China, and Hong Kong, following its September 2024 benchmark update). During global recessions, international stocks tend to fall alongside—or even more than—U.S. stocks, and they introduce additional variables like currency risk and geopolitical uncertainty.
After the 2008 crisis, the I Fund took significantly longer to recover than the C Fund, and it still underperformed U.S. equities for more than a decade afterward. While international diversification has value in certain environments, the I Fund has historically been the weakest performer during and after U.S. recessions.
See how the TSP Model helps you evaluate your current TSP allocation, manage risk more confidently, and make smarter decisions for today’s market.
This is the single most destructive decision a TSP investor can make, and it happens with alarming frequency during every downturn. Here’s the typical pattern: the market drops 20–30%, an investor can’t take it anymore and moves everything to the G Fund, and then the market recovers over the following months—without them.
During the COVID crash in March 2020, a significant number of TSP participants moved their entire balance to the G Fund near the bottom. By year’s end, the C Fund had recovered all its losses and finished up roughly 18% for the year. Those who sold and stayed in the G Fund earned approximately 1%.
The difference between those two outcomes on a $400,000 TSP balance is roughly $68,000—in a single year.
The opposite extreme—refusing to make any changes regardless of conditions—can be just as costly. Buy-and-hold investors who stayed fully invested in the C Fund through the 2008 financial crisis sat through a 51% peak-to-trough decline and didn’t recover to their pre-crisis balance for several years.
The conventional wisdom that you should simply “stay the course” during downturns is based on an outdated approach to investing known as strategic asset allocation. While it’s true that you shouldn’t panic-sell, there’s a meaningful difference between panic and preparation. Recognizing deteriorating economic conditions and making proactive adjustments to your allocation is not market timing—it’s intelligent risk management.
Many TSP investors assume their Lifecycle Fund will automatically protect them during a downturn. After all, these funds are supposed to be professionally managed, right?
The reality is that L Funds follow a predetermined glide path based solely on your retirement date. They do not adjust for recessions, market crashes, or any change in economic conditions. An L Fund with a 2045 target date will hold roughly the same stock-heavy allocation whether the economy is booming or entering a recession. It’s the investing equivalent of driving with cruise control on a mountain road—it keeps the same speed regardless of the curves ahead.
For a deeper look at the structural limitations of this approach, see our article on The Fatal Flaw of Target-Date Funds.
Rather than guessing when a recession will start or reacting emotionally once it arrives, successful TSP investors follow a framework that adjusts their allocations based on economic and market conditions. Here’s how to think about it.
Recessions don’t appear out of nowhere. They are preceded by deteriorating economic indicators—weakening employment data, declining manufacturing activity, tightening credit conditions, and shifts in the yield curve. The challenge for individual investors is knowing which signals to trust and when they’re reaching critical thresholds.
In the current environment, several factors warrant close attention. Trade policy uncertainty continues to create headwinds for business investment. Consumer spending, while still positive in aggregate, is increasingly driven by higher-income households, with lower-income consumers showing signs of financial strain. The labor market remains relatively strong, but job growth has been narrowing.
If you’re monitoring these conditions and see warning signs accumulating, a prudent first step is to begin shifting a portion of your TSP allocation toward the G and F Funds. You don’t have to go from 100% stocks to 100% bonds overnight. Gradual adjustments—increasing your G and F Fund allocation from, say, 10% to 30–40%—can significantly reduce your downside exposure while keeping you positioned for continued growth if the expansion persists.
Once a recession is confirmed and the primary trend of the market has turned bearish, the priority shifts to capital preservation. History shows that bear markets associated with recessions typically last 12 to 18 months and produce average stock declines of 30–40%.
During this phase, a defensive TSP allocation might look something like this:
| TSP Fund | Defensive Allocation |
| G Fund (Government Securities) | 50–60% |
| F Fund (Bonds) | 30–40% |
| C Fund (S&P 500) | 0–10% |
| S Fund (Small Cap) | 0% |
| I Fund (International) | 0% |
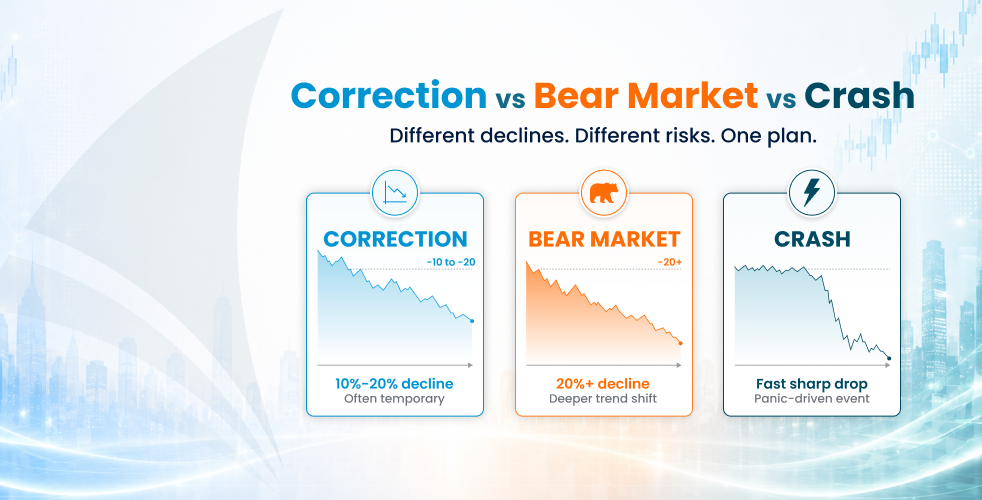
The goal isn’t to avoid stocks forever—it’s to reduce exposure during the period when the most damage occurs. As discussed in our article on Corrections vs Bear Markets, the key distinction is between temporary pullbacks during healthy economies (corrections) and the sustained declines that accompany recessions (bear markets). Corrections are opportunities to hold steady. Bear markets are the ones that destroy portfolios.
The recovery phase is where the real money is made. When economic data begins to stabilize, credit markets thaw, and the Fed signals accommodative policy, the primary trend of the market typically shifts from bearish back to bullish. This is the time to begin increasing your allocation to the C and S Funds.
Historically, the first 12 months of a new bull market have produced some of the strongest returns in stock market history. Investors who were positioned in the G Fund for safety during the downturn and then transitioned back to stocks during the early recovery captured the best of both worlds: limited losses during the decline and full participation in the rebound.
The timing of this transition is critical. Move back too early and you may catch another leg down. Move back too late and you miss the sharpest gains. This is where having a disciplined, data-driven approach becomes invaluable—it removes the guesswork and the emotional decision-making from what is arguably the most important allocation decision you’ll make.
The framework above outlines the right principles, but executing it consistently on your own is where most investors fall short. Monitoring economic indicators, interpreting conflicting data, and making disciplined allocation changes month after month requires time, expertise, and emotional detachment that few individual investors can sustain.
This is exactly why we built the TSP Allocation Model.
Our TSP Model dynamically adjusts your allocations across the G, F, C, S, and I funds based on current economic data and market conditions. It follows the same principles outlined in this article—owning growth-oriented funds during economic expansions and shifting to defensive positions during downturns—but it does so systematically, without emotion, and with the benefit of institutional-quality research.
The results speak for themselves. Over the 26 years from 2000 through 2025, the TSP Allocation Model generated a compound annual return of 9.73%, compared to 8.08% for the C Fund. More importantly, the model’s maximum drawdown was limited to 22.8%, compared to the C Fund’s 50.9% peak-to-trough decline. That means during the worst periods, the TSP Model protected more than half the capital that a buy-and-hold C Fund investor would have lost.
For a federal employee with a $400,000 TSP balance, that difference in downside protection translates to roughly $112,000 in preserved capital during a major market crash—money that continues to compound and grow during the recovery rather than simply digging out of a hole.
| TSP Model | C Fund (S&P 500) | |
| Compound Annual Return | 9.73% | 8.08% |
| Maximum Drawdown | -22.8% | -50.9% |
| Standard Deviation | 10.8% | 18.0% |
| Sharpe Ratio | 0.77 | 0.43 |
Data for 26-year period (2000–2025). Model performance represents total returns including reinvestment of dividends and interest. No management fees or transaction costs included. Past performance is not a guarantee of future results.
Regardless of where we are in the economic cycle, the worst time to figure out your recession strategy is during a recession. Here are three steps you can take right now.
Log in to TSP.gov and review how your balance is currently distributed across the G, F, C, S, and I funds. Many TSP investors haven’t looked at their allocation in years. If you’re not sure how to check or make changes, our guide on How to Update TSP Allocations on TSP.gov walks you through it step by step.
Ask yourself: if the stock market dropped 30–40% over the next 12 months, would my current allocation survive? If the answer makes you uncomfortable, it’s worth considering a shift toward a more balanced allocation before conditions deteriorate. Our article on Strategic vs Tactical Investing explains the different approaches and why a tactical strategy often delivers better risk-adjusted returns.
You don’t have to navigate this alone. The TSP Allocation Model provides clear, monthly recommendations that tell you exactly how to allocate your TSP based on current conditions. There’s no guesswork involved. When the model detects weakening economic conditions, it shifts your allocation defensively. When conditions improve, it moves you back into growth funds. You simply log in, check the latest recommendation, and make the update in your TSP account.
You can try the TSP Allocation Model free for an entire month with no upfront charges. Visit our Pricing page to get started and see current model recommendations.
Recessions are a normal and inevitable part of the economic cycle. They are not pleasant, but they are survivable and for prepared investors, they can even be opportunities.
The federal employees who come through recessions in the strongest position are those who understand their TSP fund options, avoid emotional decision-making, and follow a disciplined strategy that adjusts to changing conditions. Whether you choose to manage your allocations independently or use a data-driven tool like the TSP Allocation Model, the most important thing is to have a plan before you need one.
Your TSP is likely the largest single retirement asset you own. Treat it accordingly. The decisions you make today, especially the decision to prepare rather than react, will compound for decades.
Follow a rules-based TSP strategy designed to help you respond to market conditions with more clarity, less emotion, and a more disciplined plan.
The Model Investing Research Team, led by Chief Investment Strategist Matthew Kerkhoff, is a group of finance professionals, data scientists, and software engineers committed to helping individuals make smarter investment decisions. By combining advanced analytics, behavioral science, and market expertise, they simplify complex financial concepts and deliver clear, actionable insights. Their mission is to empower investors of all levels with the knowledge and tools needed to achieve financial stability and long-term success.
Read More
An innovative approach for eaming higher returns with less risk
Download Report (1.2M PDF)You don’t want to look back and know you could’ve done better.
See PricingPosted in