Everything in life comes with trade-offs. Want to be a professional athlete? Or a famous musician? Then you have to forgo building valuable skill sets in other areas in order to hone your abilities in your chosen discipline.
Investing is no different. With each and every investment that you make – whether it’s buying a house, managing your portfolio, or paying for your kids’ college, you’re going to be giving up one benefit in exchange for another. Most of the time, this trade-off is between risk and potential return. Understanding this trade-off at a conceptual level will go a long way in helping you to select the right investments (or strategies) on your path to retirement.
But before we can understand the relationship between risk and reward, we need to solidify our understanding of risk.
What is Risk?
Ask a laymen what risk is, and they’ll probably say something along the lines of, “the possibility of loss or harm.” Ask a finance professor (or Investopedia), and they’ll reply that it’s the chance that an investment’s actual return will be different from what was expected.
Those definitions are fine, but risk is actually much simpler than that. At its core, risk is simply uncertainty…
If you can avoid placing negative connotations on the concept of risk, you’ll be much better served in the long run. This is because risk is just as much about positive outcomes as it is negative.
Think about it like this. If you’re single and you leave the confines of your home, there’s a risk you might actually meet the person of your dreams. Or if you’re interviewing for a job, there’s a risk you might actually get it. Our obsession with defining risk in a negative light can hamper our ability to make sound investment decisions.
This notion of positive risk will become more clear as we get further down the rabbit hole and discuss how risk is quantified.
How Is Risk Measured?
In the world of investing, there are a variety of ways to assess risk, but the industry standard method is to look at volatility – or the tendency of an investment’s value to fluctuate in price. From a statistical perspective, we measure this using what’s called standard deviation.
In case you were napping during math class, here’s a quick primer. Standard deviation measures the dispersion of a dataset relative to its mean, or average. Let’s say we have two investments that have provided the following returns over the last five years.

In this case, Investment A has an a higher average annual return (6% vs. 4%), but it also has a higher standard deviation (6.6% vs. 2.2%). As a result, Investment A would be considered more risky than Investment B. This is because the variability in returns is much higher for Investment A than for Investment B.
To help illustrate this further, here is what these two investments look like in graphical form:

In the left chart we can see that the dispersion of possible returns for Investment A is much greater than that of Investment B. This is the essence of risk.
It’s very important to recognize here that when measuring risk, returns greater than the average return are treated no differently than returns less than the average return. In other words, regardless of whether an investment’s actual returns exceeded or fell short of its expected return, the deviation is penalized in the same way … This is why we mentioned above that risk is as much about positive outcomes as it is negative … when you limit one, you limit the other.
The Relationship Between Risk and Reward
Up to this point, we’ve alluded to the trade-off between risk and reward, but we have not explained it. Let’s do that now.
Generally speaking, it is assumed that when an investor wants to earn a higher return, they must assume more risk. Now that you understand that risk is measured using volatility or standard deviation, the following chart should make sense.
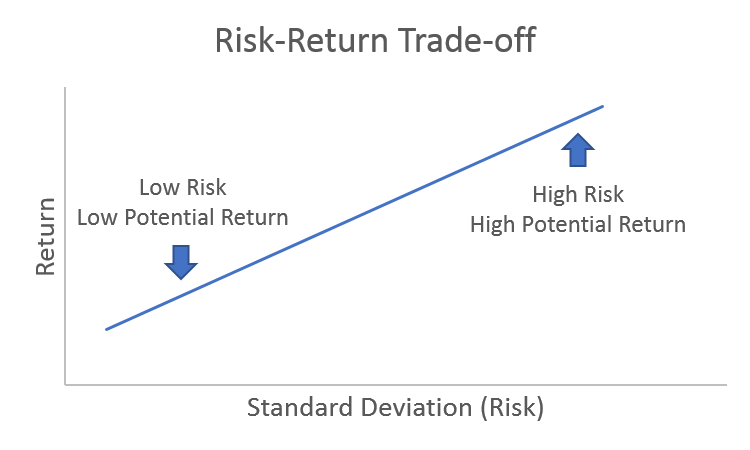
This chart highlights the basic relationship between risk and reward, but a word of caution: Risk levels for various investments, as well as expected returns, are constantly changing … that means this relationship is always in flux. Thus, this chart should be used as a generalization only. Risk and return do not share a linear relationship, and as we’ll see in the next section, taking more risk does not always imply a higher expected return.
But first, let’s get away from all this hypothetical talk and give you something you can sink your teeth into. One of the primary ways that the risk-return trade-off is incorporated into a portfolio is through the selection of various asset classes. In the chart below, we can see BlackRock’s long-term equilibrium risk and return assumptions for various types of stocks (equities) and bonds (fixed income).
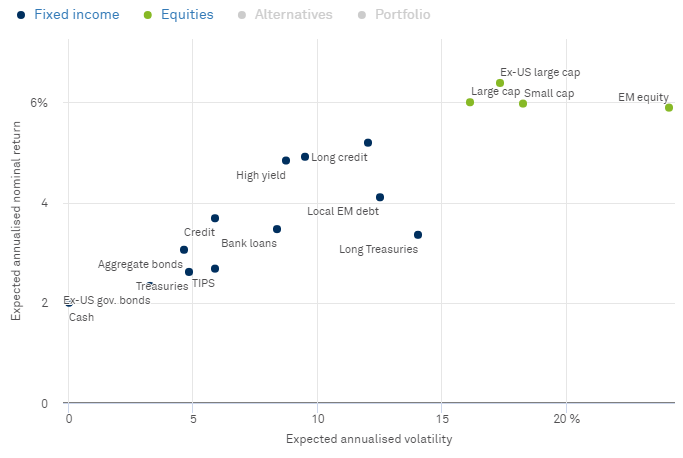
There are only two things that you really need to take away from this chart. First, as we saw in the prior chart, there is an upward sloping relationship between risk and reward. Second, stocks will typically provide both higher returns, and experience higher volatility (risk), than bonds.
But … and this is a critical point … that is not always the case. For example, near the end of an economic expansion, stocks can actually have lower expected returns than bonds, and vastly higher expected volatility, which makes them a very poor bet compared with owning bonds.
On the flip side, shortly after an economic recession, stocks can exhibit extremely high expected returns and low volatility, making them a much better alternative to bonds. Thus, the risk-reward trade-off for any investment (or asset class) is always changing, and is heavily dependent on economic and financial market conditions.
Higher Risk Does Not Always Mean Higher Returns
Now that you’re starting to get the hang of this, let’s go through a quick exercise to test your risk-management skills.
Let’s say you have the option of choosing between the following two investments. Which would you choose?

If you’ve understood everything that we’ve covered so far, then hopefully you chose Investment #2 … but why? In this case, both investments offer the same average (or expected) annual return, but Investment #2 has much lower risk. In fact, it has about half as much risk (volatility) as Investment #1. Here’s a look at the return distributions for both investments:

This is a perfect example of when higher risk does not imply a higher expected return. Being able to recognize situations like this when they arise, and steer clear of them, is an integral part of being a savvy investor.
The Final Puzzle Piece: Required Rate of Return
At this point we can begin to put the finishing touches on our discussion about risk and return. But there is one last concept we must grasp: the required rate of return.
In the last section, the example we walked through was a no-brainer. When faced with various investment options that have the same expected return, you will always choose the one with lower risk (unless you’re the risk-seeking type who is always out base jumping or wing-suit flying). At the same time, when faced with various investment options that have roughly the same risk, you’ll always choose the one with the higher expected return …
But what happens when both the expected return AND risk are higher for one investment (as in the very first example we looked at). How do you choose then?
The answer comes down to our own individual required rate of return. That is, the return our portfolio must earn in order for us to achieve our financial goals. Using the data from our first example, if we only need our portfolio to grow by 3-4% per year to reach our investment goals, then Investment B would be the way to go. On the other hand, if we need our portfolio to grow at a slightly faster rate, then we must determine whether we are willing to accept the additional risk that comes with Investment A. If so, then A is the way to go.
As you can see, this decision becomes very subjective and is largely influenced by our own individual aversion to risk. In making these decisions, it’s important to remember the concept of positive risk. When you opt for a “lower risk” investment or strategy, you’re not only limiting the chance that your return will come in below what was expected, you’re also limiting the chance that it will come in above. So make sure that you don’t always assume that lower risk is preferable.

An innovative approach for eaming higher returns with less risk
Download Report (1.2M PDF)You don’t want to look back and know you could’ve done better.
See Pricing