

Tune in to the stock market on any given day, and you’ll likely find the major averages zooming in one direction or the other. Sometimes the moves are choppy, rising and falling while generally heading nowhere, while other times the market can seemingly run for weeks or months in one direction.
To the novice investor, this volatility can be not only confusing, but nauseating. Watching your portfolio rise and fall by up to 5% in a single day is enough to make anyone feel like they’re stuck on a roller coaster.
But since we know that stocks have historically generated the highest returns for investors, and are likely to continue doing so, we can’t ignore this lucrative asset class. Instead, we need to embrace stocks with open arms and learn to expect, and accept, their unruly moves.
In this article, we’re going to provide a lens through which to view market volatility. Once you have a solid understanding of what “normal” volatility looks like, you’ll be better prepared to handle both your portfolio, and your emotions – the latter being a critical but often overlooked factor behind successful investing.
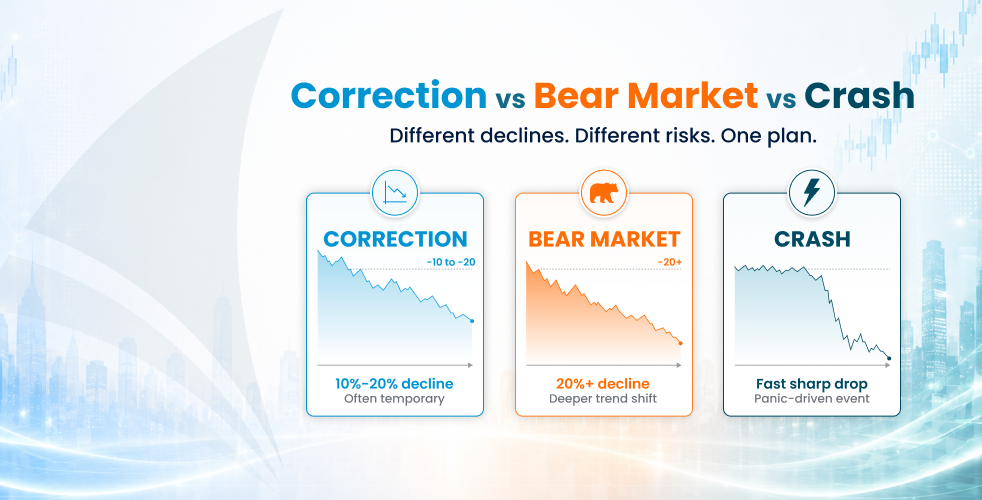
In order to get a complete view of market volatility, we’ll examine what normal daily volatility looks like, as well as what to expect in terms of corrections (defined as a drop of more than 10% but less than 20%), and bear markets (a decline in excess of 20%). So strap in as we learn how to get comfortable being uncomfortable.
Daily Volatility
The best way to get a feel for what an average day in the market looks like is to take a look at historical daily price fluctuations. In the chart below, we can see the distribution of daily price changes for the Dow Jones Industrial Average (DJIA) over an 87 year period from 1928 to 2016.
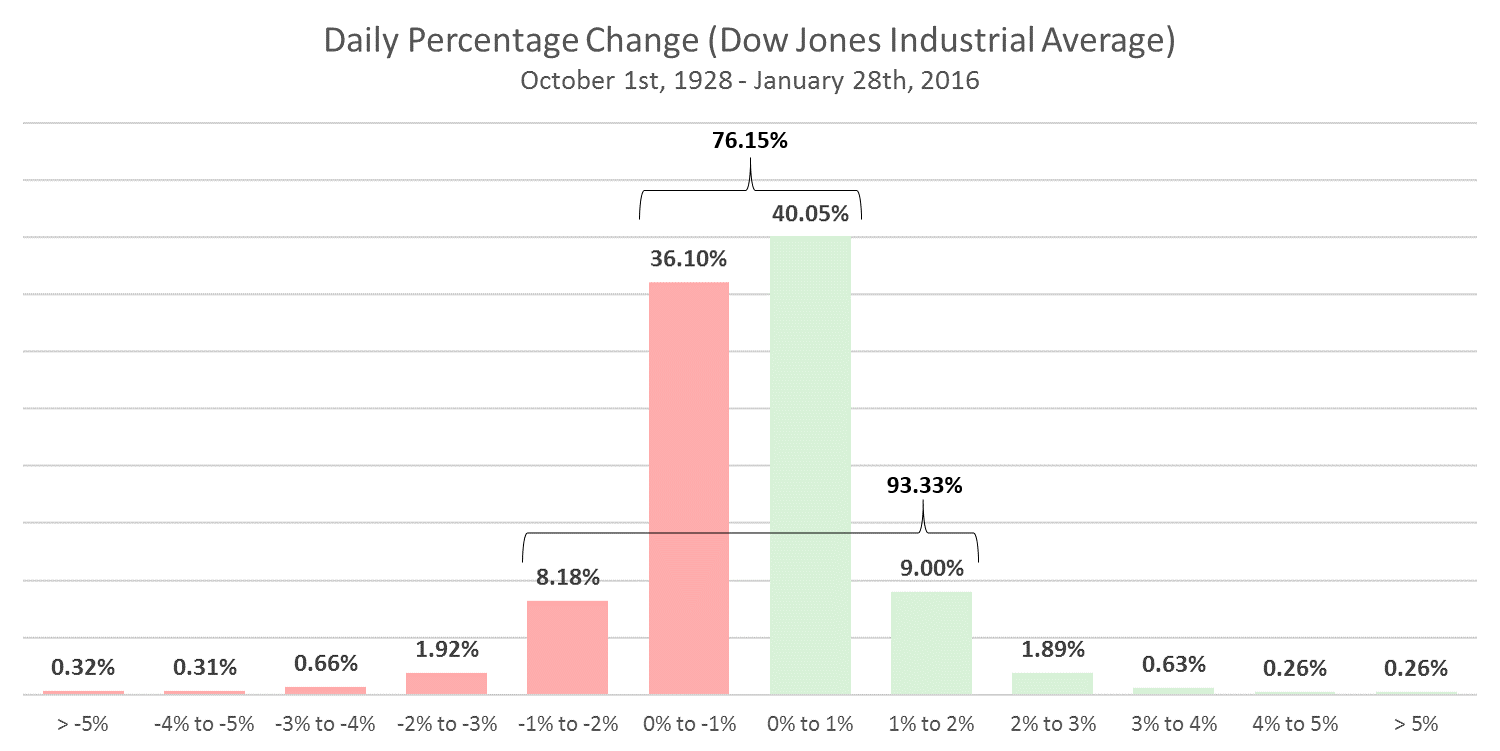
There are a few important takeaways from this chart. First, notice that daily price changes tend to follow a typical bell curve, or normal distribution. This is an indication that over the short-run (daily trading sessions) stock market behavior is mostly random (aka. noise). In other words, daily stock market fluctuations are very difficult to predict.
Examining this chart further, we can see that the vast majority of days (76.15%) see prices move within a 1% range up or down. With the DJIA currently trading near 26,000 that represents a move of up to 260 points in either direction. If we expand our range further, we find that 93.33% of the time the Dow will move less than 2% in either direction (up to a 520 point move based on the current level of the Dow).
Now let’s talk about the outlier days. If the market moves less than 2% in either direction 93.33% of the time, then it moves more than 2% in either direction 6.67% of the time. In other words, during an average year, which includes 252 trading days, the DJIA will move up or down in excess of 2% on about 17 trading days.
Most of these moves will be in the 2-3% range, but occasionally we see some larger magnitude gains and losses. Investors can generally expect about 1-2 days each year when the market will rise or fall between 4-5%, and 1-2 days each year when the market will rise or fall more than 5%. In terms of the DJIA, a 5% move represents a swing of about 1300 points.
So as you can see, big daily moves in the stock market are quite common, but most of this daily fluctuation cancels itself out over longer periods of time. As a result, it’s generally a bad idea to pay attention to daily moves in the market, and a worse idea to respond to them. Instead, allow this so-called “noise” to play itself out, and try to maintain a longer-term perspective.
Corrections
A correction in the stock market is typically defined as a drop of more than 10% from previous highs, but not more than 20%. While a 10% reduction in the value of your stock portfolio can feel like a punch to the gut, as we’ll see, moves like this are very common, and something you need to get used to.
A look back at historical data shows that the stock market experiences on average one correction per year, lasting approximately two months and resulting in about a 14% peak-to-trough decline.
Said differently, you can expect the stock portion of your portfolio to lose about 14% of its value at some point each and every year, during both good years and bad. The good news is that these market corrections are usually short-lived, and as long as you don’t overreact and liquidate your portfolio, the market typically rebounds quickly.
Here’s some real world data to back that up. From 1980 to 2015, the S&P 500 experienced an average intra-year decline of 14.2%. However, even with those large intra-year declines, the market still finished the year in positive territory 27 out of those 36 years, or 75% of the time.
In fact, if we take a longer historical view, it becomes clear that fewer than one in five corrections escalate to the point where it becomes a full-fledged bear market (where losses exceed 20%).
This brings up an important question, which is – what should you do if you think the market is due for a correction? The answer for most long-term oriented investors is: NOTHING.
Trying to time the market in the short-run is incredibly difficult, and most investors end up succumbing to their emotions and ultimately making poorly timed buy/sell decisions. Unless it looks like the economy is poised to enter a recession (more on this in the next section), your best bet is to stay the course through these normal, episodic events.
Bear Markets
Ah, now for the fun stuff. If you worry about stock market declines, it’s more than likely the prospect of a bear market that keeps you up at night. Bear markets are loosely defined as a peak-to-trough loss in excess of 20%, but as most of us know, losses during severe bear markets can be much greater than that.
Our most recent major bear market, which took place during the financial crisis in 2007-2009, saw stocks lose 58% of their value. The dot-com collapse was nearly as bad, with the S&P 500 falling 51%. But it’s important to realize that these events were two of the worst bear markets in history.
The average bear market decline is around 33%, and again, only about one in five corrections (a drop of more than 10%) will actually turn into a bear market. In the post WWII era, we’ve seen a bear market about every five years, but over the last two decades the frequency of bear markets has been decreasing.
While that might sound good initially, investors should not expect this trend to continue. Based on a variety of factors, including slowing productivity growth and labor force growth, investors should actually expect more frequent recessions moving forward. If that is indeed the case, then we’re bound to have more frequent bear markets, since nearly all economic recessions are accompanied by a bear market.
That last point is very important. While we can certainly have bear markets without economic recessions (see chart below) most of the declines during these periods are on the lower end of the spectrum. Major bear markets, on the other hand, nearly always coincide with a major downturn in the economy.
| Historical Bear Markets (Post WWII) | |||
|---|---|---|---|
| Year | Duration | Decline | Recession? |
| 2011 | 5 Months | -22% | No |
| 2007 – 2009 | 17 Months | -58% | Yes |
| 2000 – 2002 | 31 Months | -51% | Yes |
| 1998 | 3 Months | -22% | No |
| 1990 | 3 Months | -20% | Yes |
| 1987 | 2 Months | -36% | No |
| 1980 – 1982 | 22 Months | -28% | Yes |
| 1976 – 1978 | 18 Months | -20% | No |
| 1973 – 1974 | 21 Months | -50% | Yes |
| 1968 – 1970 | 17 Months | -37% | Yes |
| 1966 | 8 Months | -24% | No |
| 1961 – 1962 | 6 Months | -29% | No |
| 1956 – 1957 | 14 Months | -21% | Yes |
| 1948 – 1949 | 12 Months | -21% | Yes |
| 1946 – 1947 | 12 Months | -28% | No |
So how should an investor attempt to navigate these tumultuous periods? As mentioned earlier, you’re generally going to want to maintain your exposure to stocks through all corrections. The short-term nature of these events makes them difficult to anticipate, and even more difficult to profit from.
Benign bear markets that aren’t accompanied by an economic recession should be handled in the same fashion. These periods are essentially corrections that go a little too far, and just barely cross the threshold to be considered a bear market (decline greater than 20%).
What you should worry about, and attempt to avoid, are the major bear markets that are associated with economic recessions. This may seem difficult at first, but when you consider that the economy takes a long time to roll over, and there are many well-documented leading indicators that provide plenty of advance warning, this task is more than manageable.
Final Thoughts
Warren Buffett once said, “The stock market is a device for transferring money from the impatient to the patient.” Embracing this wisdom, it makes little sense to get scared out of the market because of large daily fluctuations, or due to a run-of-the-mill correction.
Instead, investors should embrace the idea of time in the market, as this is a critical factor in determining your overall gains. The one exception, of course, is during an economic recession.
We know that recessions are almost always accompanied by severe bear markets, and so if you don’t like the idea of your stock portfolio getting cut in half, you’re going to need employ some form of tactical asset allocation to move your portfolio to safety.
Whether that means using our investment models, finding a trusted advisor, or monitoring conditions on your own, the choice is yours. Just don’t make the mistake of riding through these unruly periods with no changes in your portfolio, as the losses can set you back for years to come.

The Model Investing Research Team, led by Chief Investment Strategist Matthew Kerkhoff, is a group of finance professionals, data scientists, and software engineers committed to helping individuals make smarter investment decisions. By combining advanced analytics, behavioral science, and market expertise, they simplify complex financial concepts and deliver clear, actionable insights. Their mission is to empower investors of all levels with the knowledge and tools needed to achieve financial stability and long-term success.
Read More
An innovative approach for eaming higher returns with less risk
Download Report (1.2M PDF)You don’t want to look back and know you could’ve done better.
See Pricing