
With the Federal Reserve having recently raised interest rates for the fourth time since the financial crisis, we thought it was an opportune time to discuss how changes in interest rates affect you as an investor.
In this article we’ll discuss the role of interest rates in an economy, how those interest rates change over time, and how those changes affect the value of different components of your portfolio. In addition, we’ll introduce you to the yield curve, a tremendously useful graphical view of interest rates that contains a wealth of information.
Introduction
If I were to ask you what’s going on with interest rates, how would you respond? If you’re like most, you’d probably quote some Wall Street Journal or NY Times article suggesting that interest rates are heading higher. But which interest rates? And why? And what does it mean for consumers and businesses?
The first thing to understand about interest rates is that they come in many shapes and sizes. There are rates that banks pay one another to borrow funds, rates that banks pay depositors for their deposits, rates that banks charge consumers for things like credit cards, auto loans and mortgages, and many, many more.
The reason there are so many interest rates is because every loan has unique circumstances. The primary factors that affect interest rates are maturity (the length of the loan) and risk, which is based on the borrower’s perceived ability to repay.
Of all the interest rates out there, only a few really matter and are worth paying attention to (at least from a general investor’s perspective). We’ll cover these in detail as we progress.
The Big Picture
Why do interest rates change? That’s a great question and the answer ultimately boils down to two main factors: the demand for cash, and the machinations of the Federal Reserve. Let’s briefly take these two in turn.
When you hear about interest rates rising and falling, more often than not the discussion involves interest rate decisions by the Federal Reserve. The Federal Reserve’s “job” so to speak, is twofold: to promote maximum employment in our economy, and to maintain price stability, which is defined as 2% inflation.
More simplistically, interest rate policy by the Federal Reserve is administered in an attempt to manage the growth of our economy. When interest rates are lowered, it entices consumers and business to borrow and spend (or invest), which promotes economic activity. On the other hand, when interest rates are raised, it’s typically done with the intention of slowing our economy to prevent it (and inflation) from overheating.
Interest rates also change as a function of the global demand for cash. We’ll get into this more in the next section, as global investors play a much larger role in determining interest rates than most people realize.
For now, all you need to understand is that the Federal Reserve is often viewed as the gatekeeper of interest rates (which is an incorrect assumption – you’ll soon know better), and that interest rate policy is administered by the Federal Reserve in an attempt to achieve slow but sustainable economic growth.
The Yield Curve
There are many “interest rates” in our economy, but they all take their cues from one place: U.S. Treasuries.
Because Treasuries are backed by the “full faith and credit of the U.S. government,” these securities are viewed by the investor community as being “risk-free” (whether that’s an accurate assessment is a topic for another day).
As risk-free investments, U.S Treasuries (and their corresponding interest rates) represent the baseline from which nearly all other loans are priced. And as you’ll soon see, watching the rates on just a couple of key U.S. Treasuries will tell you almost everything you need to know as an investor.
Before we take a look at current Treasury rates, I want to remind you of the other major factor (other than default risk) that affects interest rates, and that is maturity, or the length of the loan.
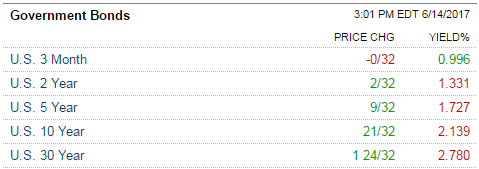
If you were going to lend me money for five years, would you charge a higher or lower rate of interest than if you were to loan me money for one year? In general, you should charge me a higher rate because there are more unknowns involved with lending money for a longer time period. This is why, as you can see in the table below, all else being equal, longer term loans tend to have higher interest rates.
This table shows the current yields (interest rates) for a few different length U.S. Treasuries. Notice that the longer the term, the higher the interest rate.
If we were to take all the different maturity Treasuries and their respective interest rates and plot them on a chart, we’d end up with what’s known as the yield curve. We can see an example of this below.
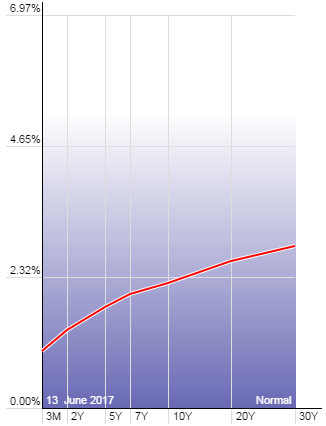
The yield curve contains an immense amount of information and you should take some time to familiarize yourself with it. In a future article, we’ll discuss how changes in the shape of the yield curve can provide very reliable indications of what’s in store for our economy, and thus asset prices (i.e. your portfolio). For now, that’s beyond the scope of this article.
Interest Rate Hikes Explained
Now that we’ve laid down a foundation, we can begin to answer some critical questions. The first, and most relevant to our current situation is, what happens when the Fed raises interest rates?
Most people make the assumption that if the Fed raises interest rates by, say, a quarter of a percent (0.25%) then all interest rates will rise by that amount. In reality, this couldn’t be further from the truth.
When the Fed “raises rates,” they are only raising one particular interest rate, which is known as the federal funds rate. This is the rate at which banks lend reserves to each other on an overnight basis, and it’s the only rate that the Fed has direct control over.
You can think of the federal funds rate as being similar to a Treasury with a 1-day maturity. In the chart of the yield curve above, the federal funds rate (not pictured) would be the rate at the farthest left side.
But only banks can borrow based on the federal funds rate, so as consumers and businesses we’re much more interested in what happens to the rest of the yield curve.
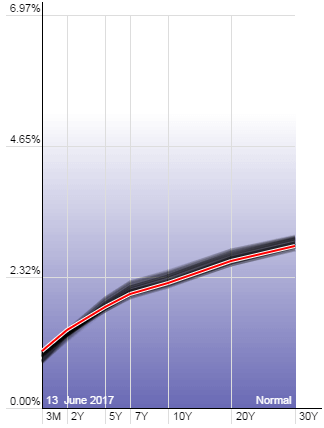
One of the most important things to understand about the yield curve (which is again pictured below), is that the left (or “short-end” – referring to maturity) is heavily influence by the Federal Reserve’s interest rate policy, but the right side or “long-end” is under the control of global investors. This distinction is critical, because it implies different segments of the yield curve (different interest rates in our economy) are reacting to completely different forces.
As mentioned earlier, the Fed controls the short-end (left side) of the yield curve by adjusting the federal funds rate up and down. As they do this, it affects shorter maturity Treasuries the most (such as the 3-month Treasury bill), but that influence begins to fade around the 2-year mark. At that maturity and longer, the yield curve becomes influenced much more heavily by the global investor community based on completely different considerations.
While the short end of the yield curve is controlled by the Fed, the long end is controlled by the prices that global investors are willing to pay for Treasury bonds. And that, in turn, is influenced by those investors’ outlook on inflation. An example will probably help here.
If you take a look at the chart of the yield curve above, you’ll notice that there is a black “shadow” behind the red line that shows the yield curve’s earlier state. This shadow indicates where interest rates were in the recent past, and allows us to see how those rates have changed over time.
There is something very unique here that you should pay close attention to.
Notice that on the left side of the chart, the shadow is below the red line, but as you pass roughly the 2-year mark, the shadow rises above the red line. What’s happening here?
This visual representation of the yield curve is demonstrating how Fed rate hikes often result in lower interest rates … huh?
Recall that the Fed can control the short end of the yield curve, but has almost no influence on rates at the long end. That is the domain of global investors and depends on the prices those investors are willing to pay for Treasuries (which in turn influences their yield).
When the Fed raises rates, it causes yields on short maturity Treasuries to rise. That’s why the red line is above its shadow on the left side of the chart. Now think for a moment about what a rate hike means for the broader economy.
As discussed earlier, rate hikes are intended to slow the economy and dampen inflation. If you are considering lending someone (like the U.S. Government) money for, say, 10-years, what’s your most important consideration? If you said erosion of purchasing power, pat yourself on the back.
The number one factor that influences rates at the long-end of the yield curve is inflation. And as the Fed raises short-term rates (the federal funds rate) it is actually acting to suppress inflation and inflation expectations. This means that yields at the long end of the curve do not need to be as high in order to compensate investors for their expected loss of purchasing power.
So oddly enough, as we can see in the chart above, interest rate hikes can and often do lead to lower interest rates for longer maturity debt … crazy, right?
What a Rate Hike Means for You
Now let’s get more personal and discuss exactly how rate hikes will influence your portfolio. In order to do this in a concise fashion, we want to narrow down our discussion of interest rates to two in particular: the prime rate, and the yield on the 10-year Treasury note.
First the prime rate.
The prime rate is a key benchmark that represents the rate at which commercial banks lend to their least-risky customers. Each bank sets their own prime rate, but they all tend to mirror one another and the average consistently sits 3% above the federal funds rate.
This means that whenever the federal funds rate is increased, the prime rate will increase by a similar amount. This is important because many adjustable rate loans (such as credit cards and home equity lines of credit) are tied to the prime rate.
An increase in the federal funds rate also impacts what’s known as LIBOR – the London Interbank Offered Rate. This is another key benchmark to which much adjustable-rate debt is tied. LIBOR is one of the most influential benchmark rates in the world and represents the rate banks charge each other for Eurodollars (U.S. dollar-denominated deposits at foreign banks) on the London interbank market.
If you have adjustable rate debt tied to either of these benchmarks (Prime or LIBOR) then you can expect an almost immediate one-for-one increase in your borrowing costs.
Now what about longer term debt such as mortgages? This is where things get interesting.
If you’re going to pay attention to any one particular interest rate, it should be the yield on the 10-year Treasury note. This rate is considered a key benchmark because it’s the rate that mortgages and most other long-term debt is priced off of.
Taking another look at our yield curve chart above, we can see that the rate on the 10-year Treasury has actually come down recently, as the Fed has raised rates. This means that mortgage rates and other long-term rates are actually lower than they were before the Fed hiked rates. Surprised? You shouldn’t be.
At this point we have all the information we need to connect the dots.
When the Fed raises rates, we know that this translates into higher borrowing costs for any adjustable rate debt tied to Prime and/or LIBOR. As you can imagine, this forces more resources to be applied to debt servicing, leaving less for consumption and investment.
The net result is a minor slowing of our economy, which causes inflationary pressures to subside. As these pressures subside, it means that long-term bond investors don’t need to demand as much yield to compensate them for the loss of purchasing power. As a result, yields on longer-term Treasuries have a tendency to fall, resulting in an overall “flattening” of the yield curve.
When the yield curve flattens completely, or actually inverts, it’s generally a bad sign for the economy, but that’s the topic for another article.
Final Considerations
At this point you should have a much better understanding of interest rates than most. But there are a few considerations you should be aware of.
The first is that this process in which Fed rate hikes often lead to lower rates on longer-dated bonds can work in reverse as well. When the Fed lowers the federal funds rate, they do so in an attempt to stimulate the economy. This raises economic growth and inflation prospects and can cause long-term bond investors to demand more yield in order to compensate themselves for the expected increase in loss of purchasing power.
The second consideration is that long-term interest rates (using the 10-year as a proxy) can and do move completely independently from interest rate changes made by the Federal Reserve. Again, most of this is a result of changes in inflation expectations as our economy ebbs and flows.
Finally, for those of you who are heavily invested in bonds, please recognize that bond prices move inversely with yields (interest rates). Therefore, if we do see a pickup in inflation and longer-term interest rates begin to rise, it’s going to cause a lot of pain (losses) for bond holders. One way to help mitigate this “interest rate risk” is to use individual bonds instead of bonds funds, which you can learn more about here.

The Model Investing Research Team, led by Chief Investment Strategist Matthew Kerkhoff, is a group of finance professionals, data scientists, and software engineers committed to helping individuals make smarter investment decisions. By combining advanced analytics, behavioral science, and market expertise, they simplify complex financial concepts and deliver clear, actionable insights. Their mission is to empower investors of all levels with the knowledge and tools needed to achieve financial stability and long-term success.
Read More
An innovative approach for eaming higher returns with less risk
Download Report (1.2M PDF)You don’t want to look back and know you could’ve done better.
See Pricing